Open Access
Fig. 8
Download original image
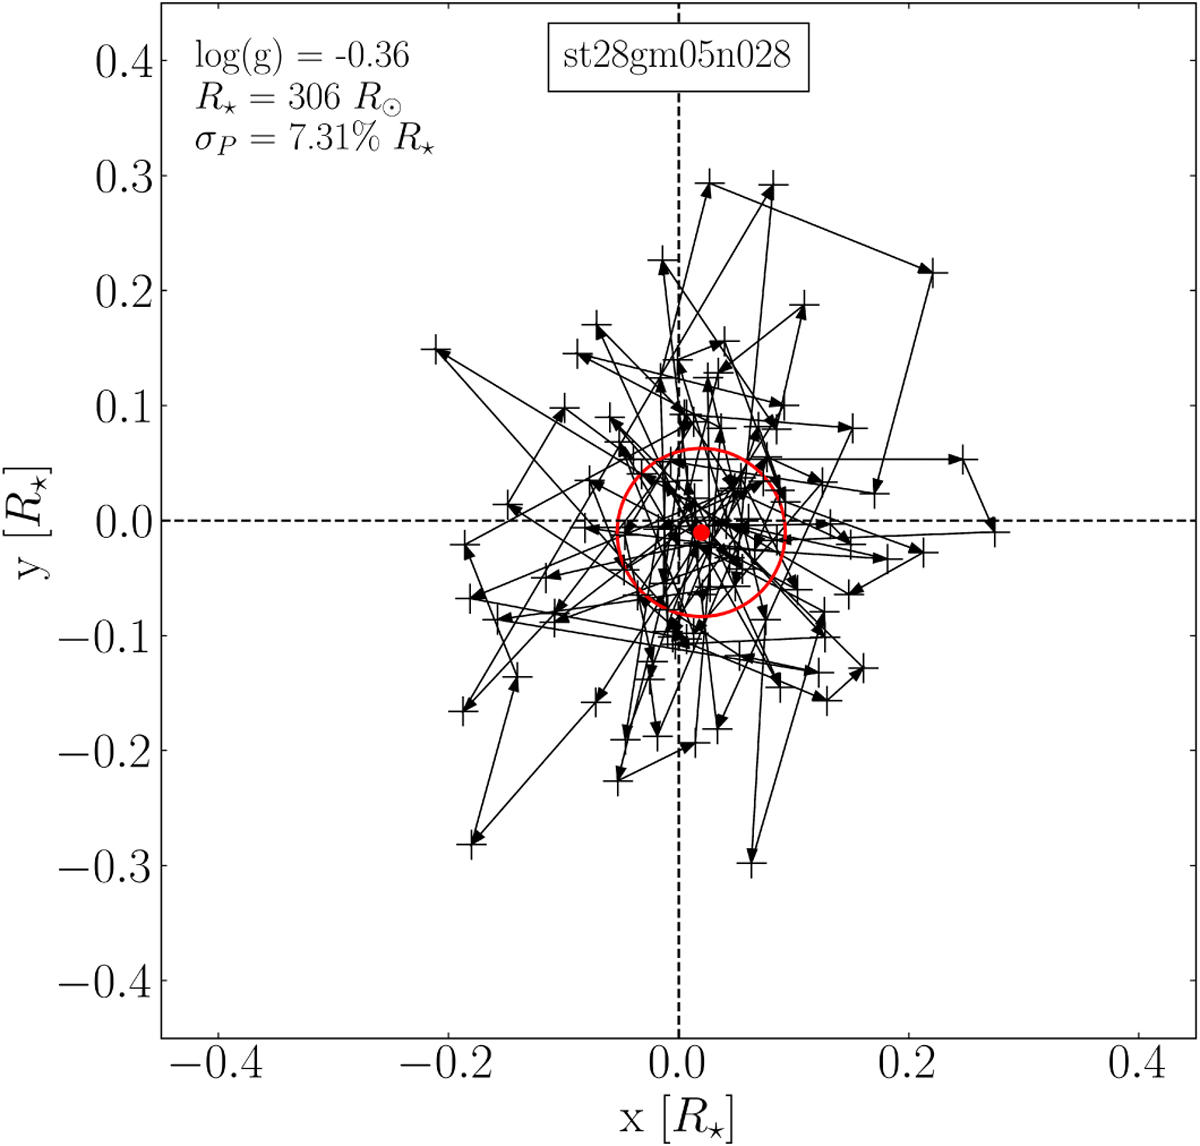
Temporal evolution of the photocentre displacement for an AGB simulation, here st28gm05n028, same as in Fig. 7. The dashed lines intersect at the geometric centre of the image. The red dot indicates the average position of the photocentre and the red circle its standard deviation.
Current usage metrics show cumulative count of Article Views (full-text article views including HTML views, PDF and ePub downloads, according to the available data) and Abstracts Views on Vision4Press platform.
Data correspond to usage on the plateform after 2015. The current usage metrics is available 48-96 hours after online publication and is updated daily on week days.
Initial download of the metrics may take a while.