Fig. 5
Download original image
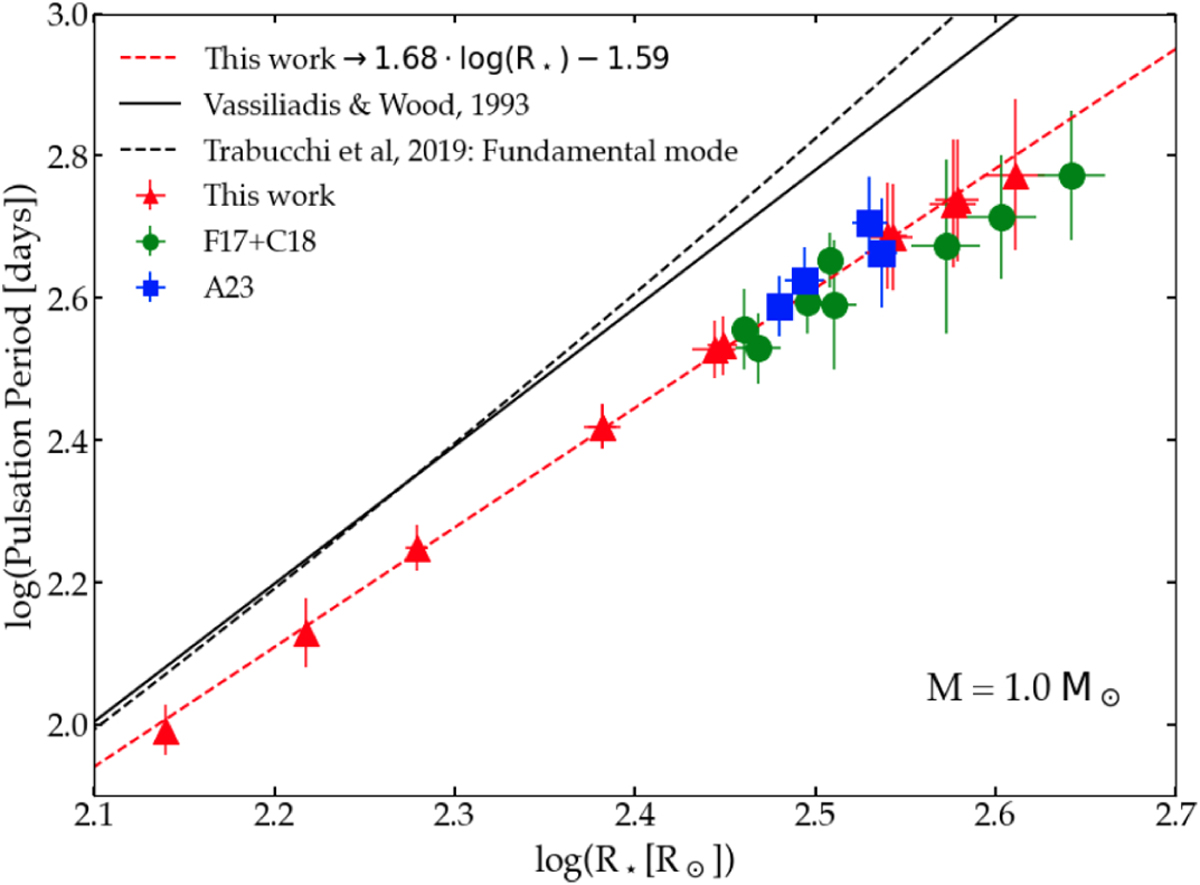
Case of the 1.0 M⊙ simulations: Log-log of the pulsation period [days] versus the stellar radius, R★[R⊙]. We compare the analytical law established here (dashed red curve) with the law from Vassiliadis & Wood (1993) (black curve) and with the fundamental mode from Trabucchi et al. (2019) (dashed black curve). Overall, we found similar trends, only separated by an offset. The pulsation periods of the simulations are shorter than expected.
Current usage metrics show cumulative count of Article Views (full-text article views including HTML views, PDF and ePub downloads, according to the available data) and Abstracts Views on Vision4Press platform.
Data correspond to usage on the plateform after 2015. The current usage metrics is available 48-96 hours after online publication and is updated daily on week days.
Initial download of the metrics may take a while.