Open Access
Fig. 3
Download original image
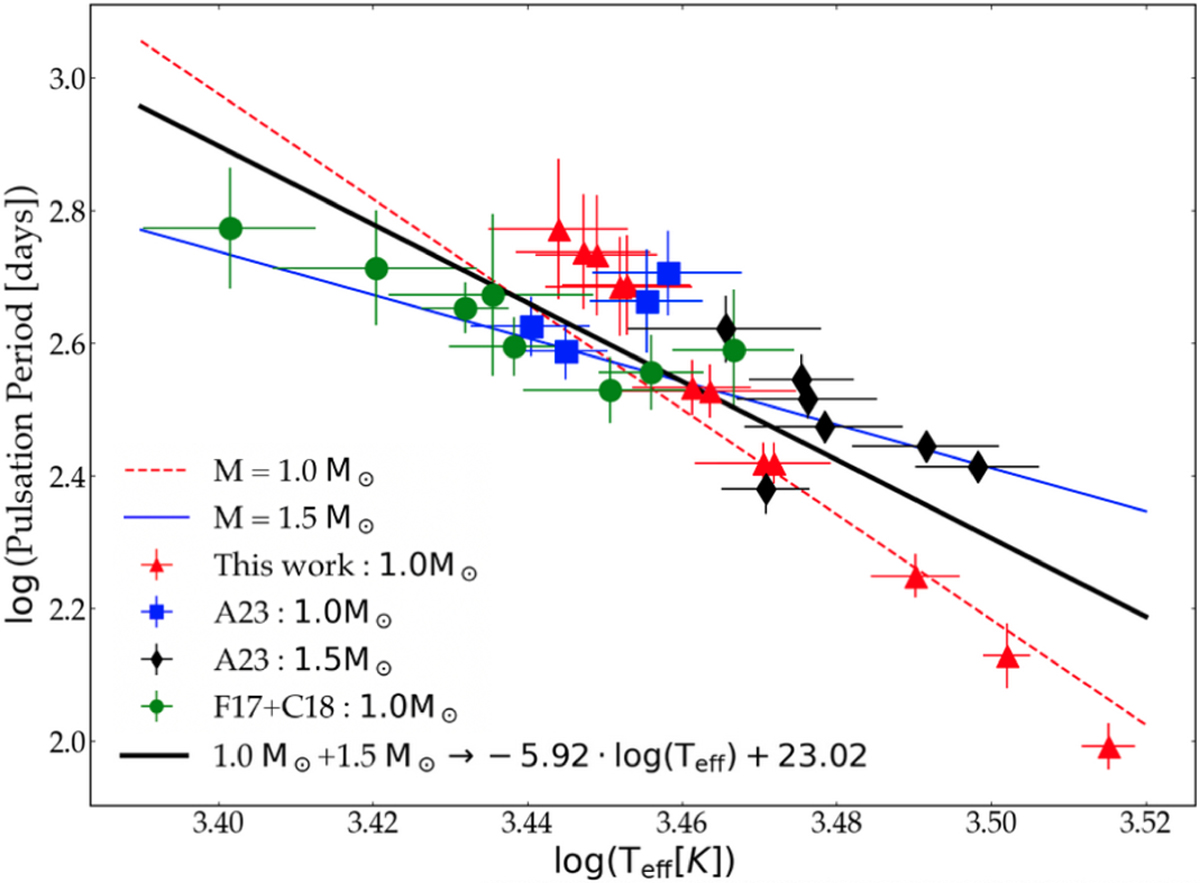
Log-log plot of the pulsation period [days] versus the effective temperature, Teff [K], which is in agreement with photosphere dynamics. We notice two groups of data (above and below the black curve) that are not linked to mass. The linear relation is given in Eq. (3).
Current usage metrics show cumulative count of Article Views (full-text article views including HTML views, PDF and ePub downloads, according to the available data) and Abstracts Views on Vision4Press platform.
Data correspond to usage on the plateform after 2015. The current usage metrics is available 48-96 hours after online publication and is updated daily on week days.
Initial download of the metrics may take a while.