Fig. 14
Download original image
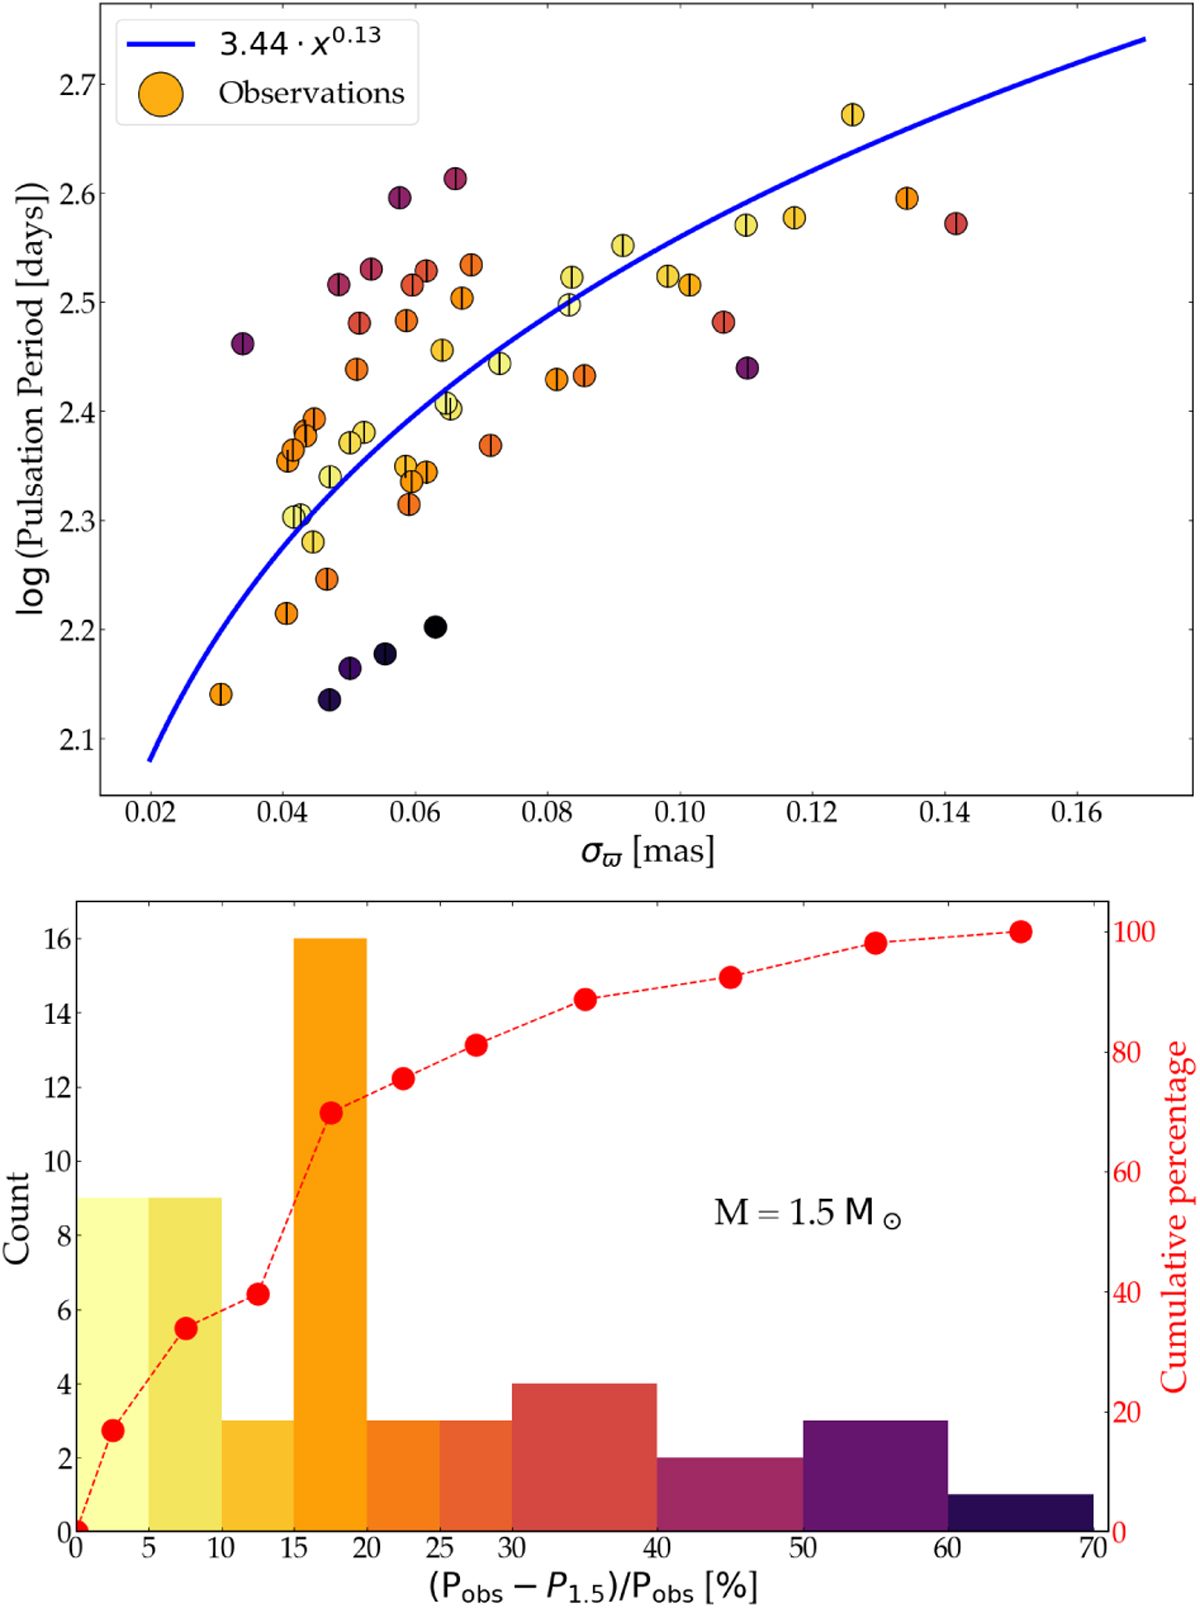
Comparison of the pulsation period of the sample between observations and estimations from the simulations where M★ = 1.5 M⊙. Top panel: pulsation period, Pobs, in logarithmic scale versus the parallax uncertainty of the observed sample, the blue curve being the Eq. (9) inferred from the analysis of the 1.5 M⊙ simulations. The colours represent the relative difference between the pulsation period calculated from Eq. (9) and with the observations. Bottom panel: histogram of these relative differences. The red line accounts for the cumulative number of stars in the respective and preceding bins (see right-hand Y-axis).
Current usage metrics show cumulative count of Article Views (full-text article views including HTML views, PDF and ePub downloads, according to the available data) and Abstracts Views on Vision4Press platform.
Data correspond to usage on the plateform after 2015. The current usage metrics is available 48-96 hours after online publication and is updated daily on week days.
Initial download of the metrics may take a while.