Fig. 13
Download original image
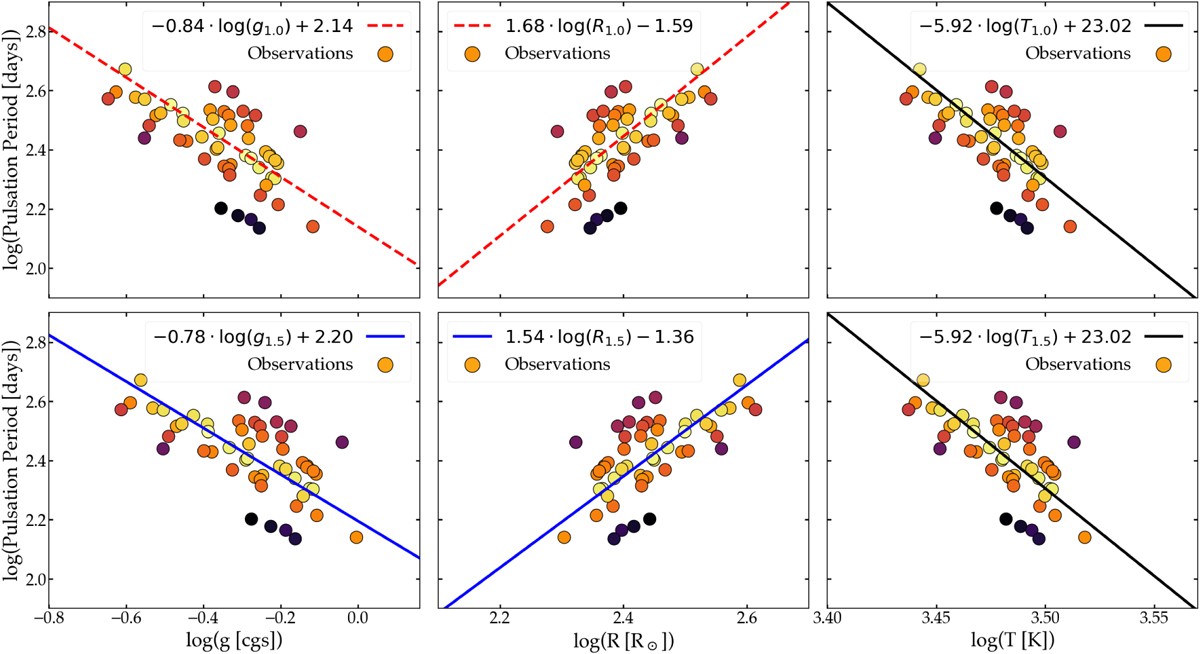
Pulsation period from the observations versus stellar parameter values obtained from the simulations. Top row: pulsation period versus log(g) (left column), log(R★) (central column), log(Teff) (right column), each computed thanks to the analytical laws derived from the 1.0 M⊙ simulations. Bottom row: same as in the top row for the 1.5 M⊙ simulations. The equation of each law is given in the legend and is reported in Fig. 15. The colour scale used is the same as in Figs. 12 and 14.
Current usage metrics show cumulative count of Article Views (full-text article views including HTML views, PDF and ePub downloads, according to the available data) and Abstracts Views on Vision4Press platform.
Data correspond to usage on the plateform after 2015. The current usage metrics is available 48-96 hours after online publication and is updated daily on week days.
Initial download of the metrics may take a while.