Fig. 9
Download original image
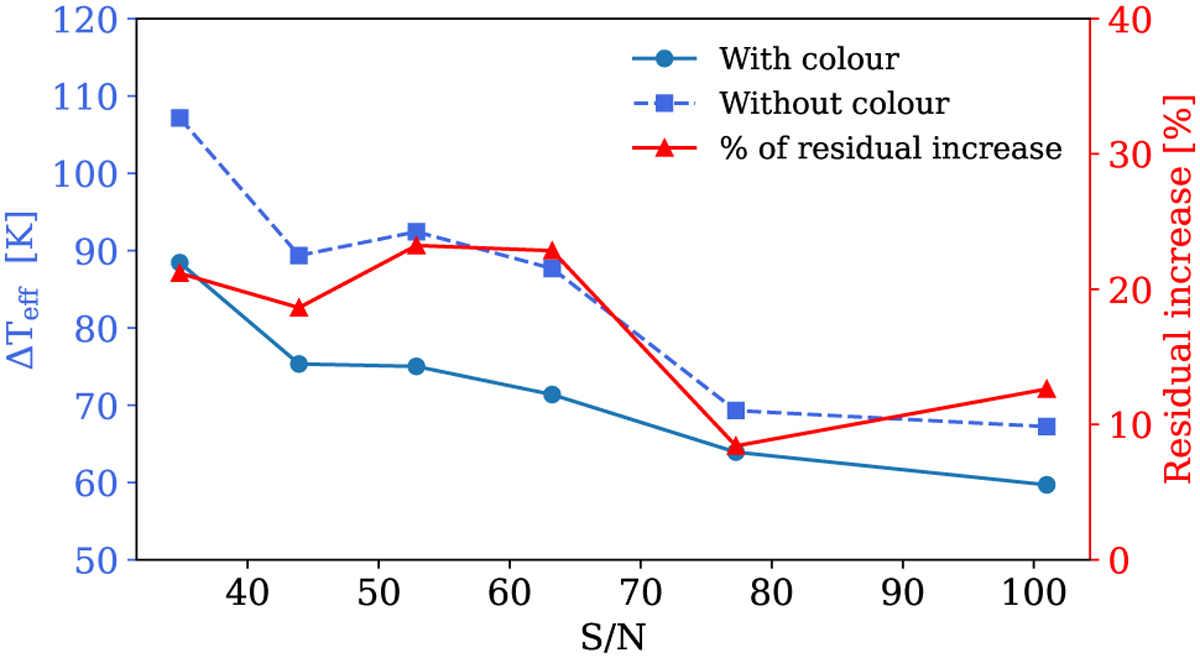
Relation between the residuals of the transformed and the ‘original’ APOGEE-2 values for effective temperature as a function of the S/N of the input data is depicted for two cases: when colours are used for the transformation (circles) and when colours are not used (squares). The red line shows the percentage increase in the residual of the effective temperature for the transformation without colours compared to the transformation using colours.
Current usage metrics show cumulative count of Article Views (full-text article views including HTML views, PDF and ePub downloads, according to the available data) and Abstracts Views on Vision4Press platform.
Data correspond to usage on the plateform after 2015. The current usage metrics is available 48-96 hours after online publication and is updated daily on week days.
Initial download of the metrics may take a while.