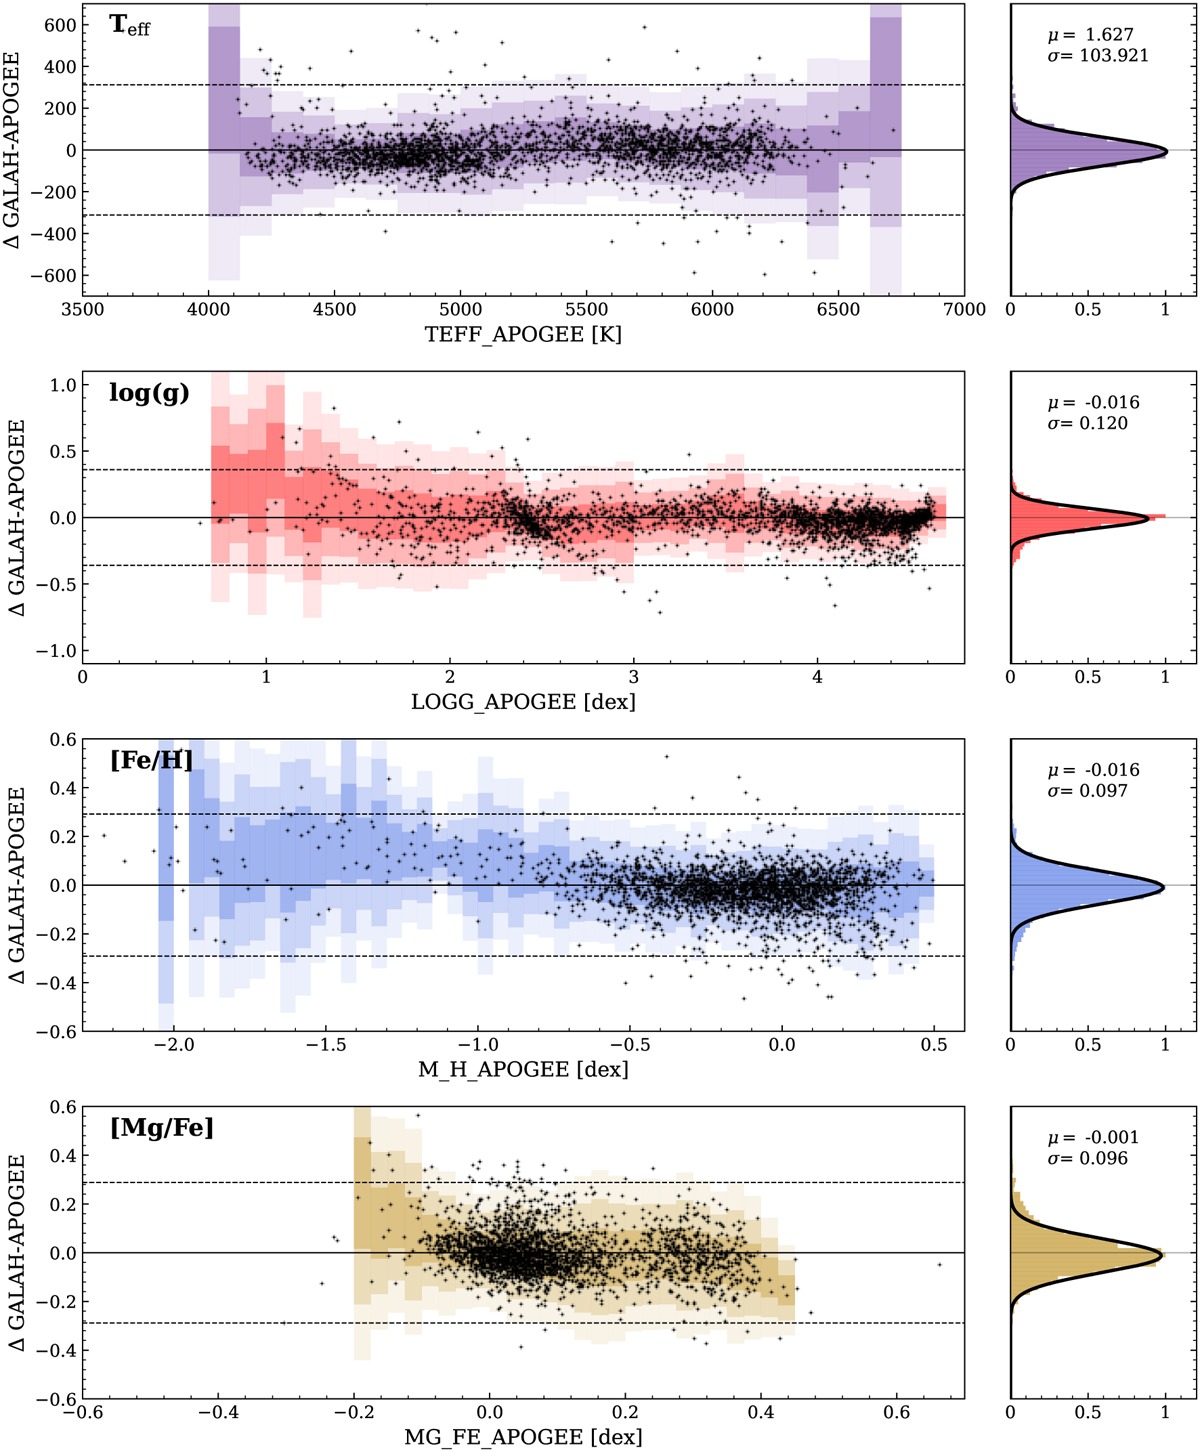
Fig. 6
Download original image
Variation of the residuals between “original” GALAH (XA) and APOGEE-2 (XB) values for each output parameters. Left: validation set shown with black points, while the shaded areas correspond to the 1, 2, and 3σ around the local mean of the residual obtained from the training set. Bins where the number of stars in the training set is lower than five are not shown, due to the poor statistic in them. The horizontal dashed lines correspond to the average 3σ of the residuals. Right panels: the coloured histograms show the difference between the ‘original’ GALAH (XA) and APOGEE-2 (XB), and black curve shows the Gaussian fitted to this histogram used to measure the average mean and standard deviation of the residuals, which are quoted on the right panels of each parameters.
Current usage metrics show cumulative count of Article Views (full-text article views including HTML views, PDF and ePub downloads, according to the available data) and Abstracts Views on Vision4Press platform.
Data correspond to usage on the plateform after 2015. The current usage metrics is available 48-96 hours after online publication and is updated daily on week days.
Initial download of the metrics may take a while.