Fig. 5
Download original image
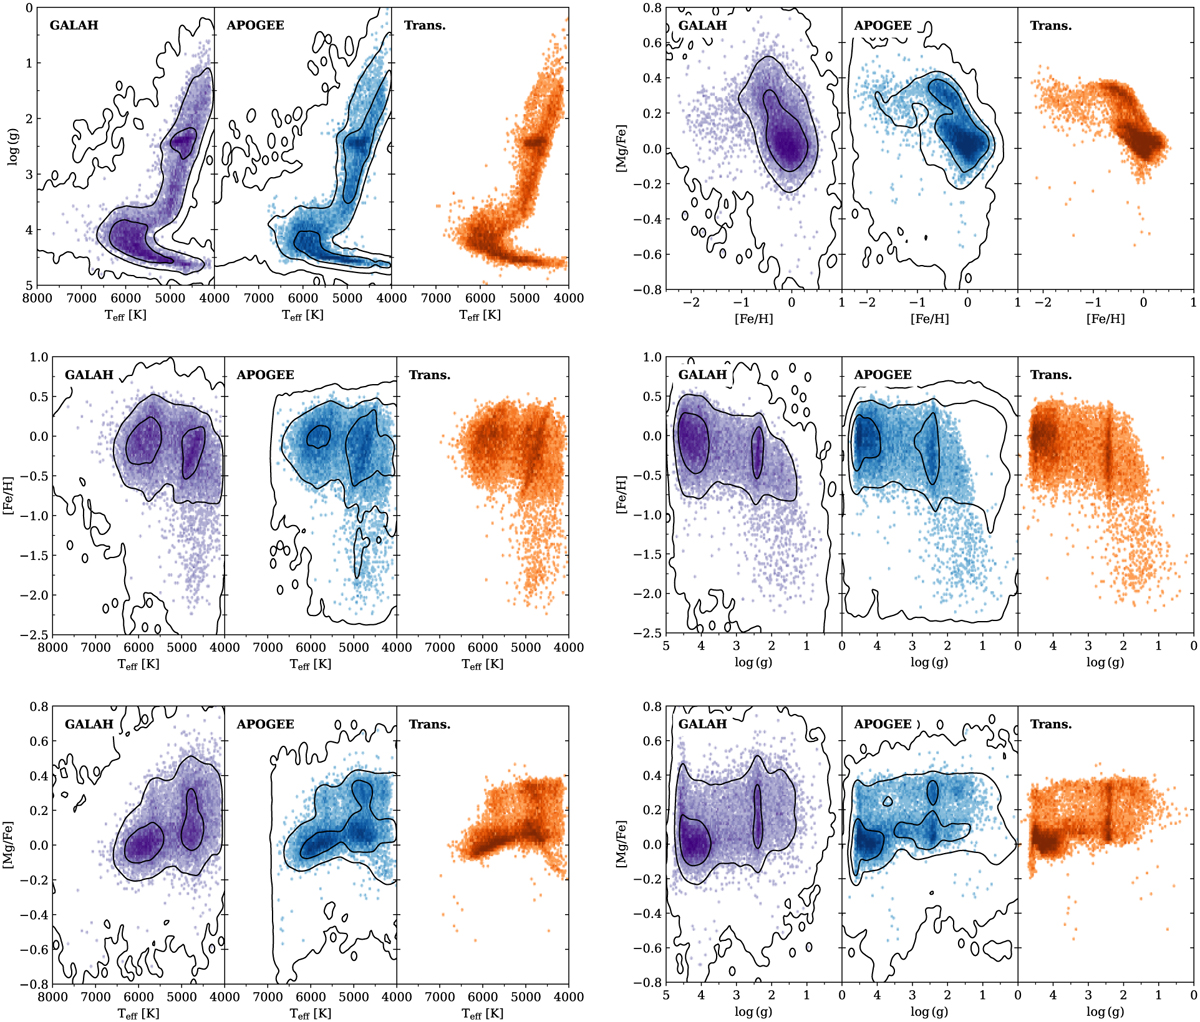
Comparison between the coverage of the parameter space for stars in the training sample using the original GALAH data (in purple, left panels), the original APOGEE-2 data (in blue, middle panels) and the parameters transformed from the GALAH into the APOGEE-2 base by the SPECTROTRANSLATOR algorithm (in orange, right panels). The contours in the right and middle panels depict the 1, 10, and 100 stars per bin limits in the selected GALAH DR3 catalogue (refer to Section 3.1.1) and APoGEE DR17 (refer to Section 3.1.2), respectively.
Current usage metrics show cumulative count of Article Views (full-text article views including HTML views, PDF and ePub downloads, according to the available data) and Abstracts Views on Vision4Press platform.
Data correspond to usage on the plateform after 2015. The current usage metrics is available 48-96 hours after online publication and is updated daily on week days.
Initial download of the metrics may take a while.