Open Access
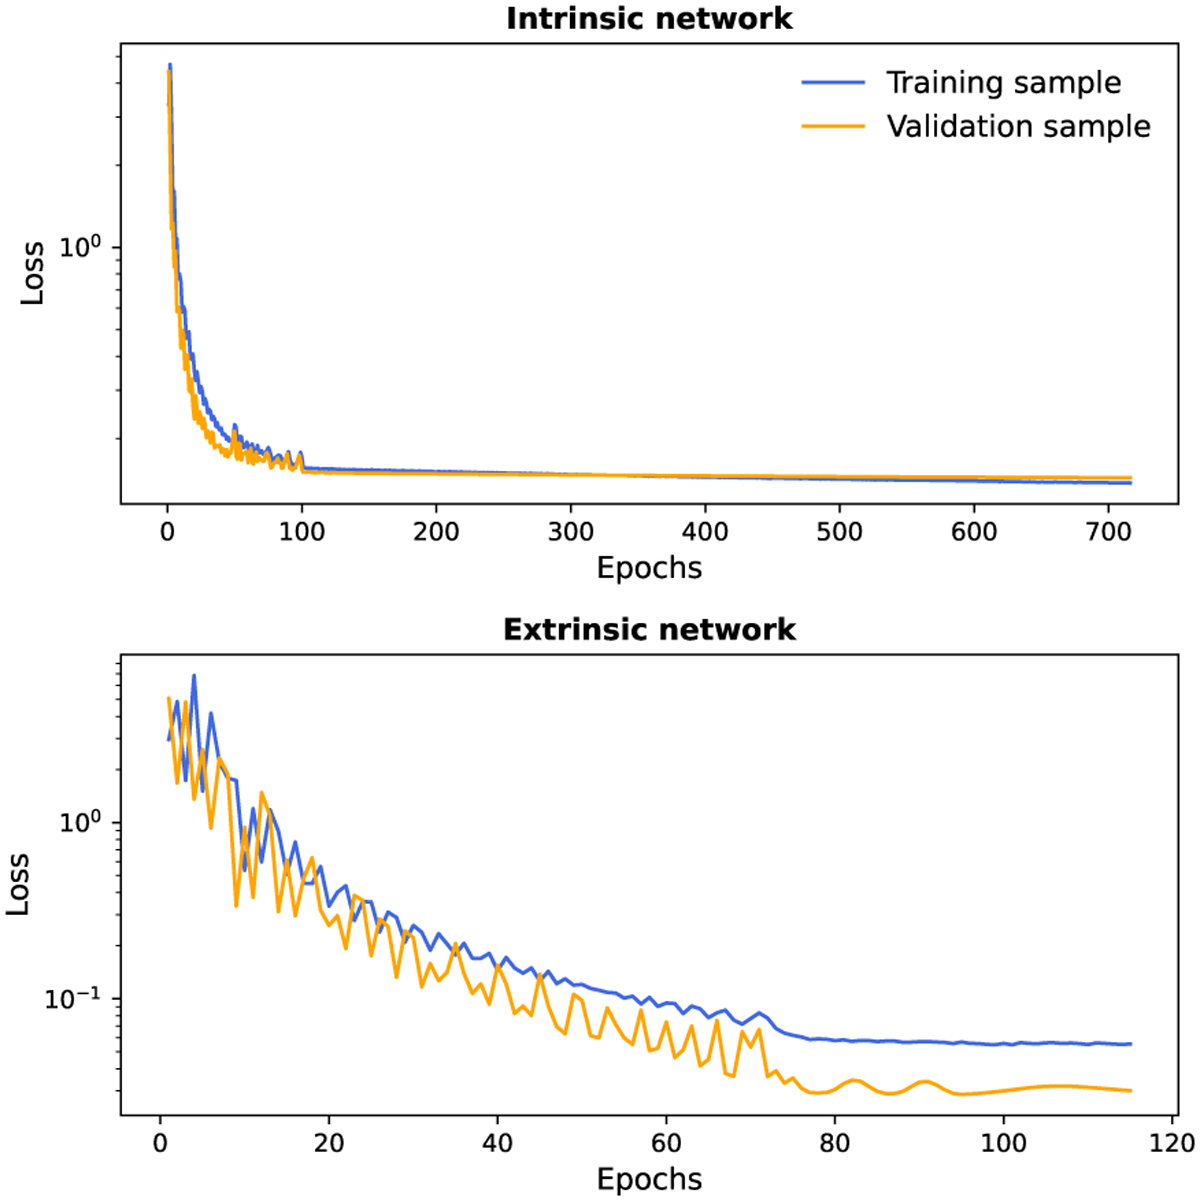
Fig. 4
Download original image
Evolution of the loss function as a function of the epoch for the intrinsic network (on the top panel), and of the extrinsic network (on the bottom panel). The loss of the training sample is shown by the blue curve, while the one of the validation sample is shown by the orange line.
Current usage metrics show cumulative count of Article Views (full-text article views including HTML views, PDF and ePub downloads, according to the available data) and Abstracts Views on Vision4Press platform.
Data correspond to usage on the plateform after 2015. The current usage metrics is available 48-96 hours after online publication and is updated daily on week days.
Initial download of the metrics may take a while.