Fig. 19
Download original image
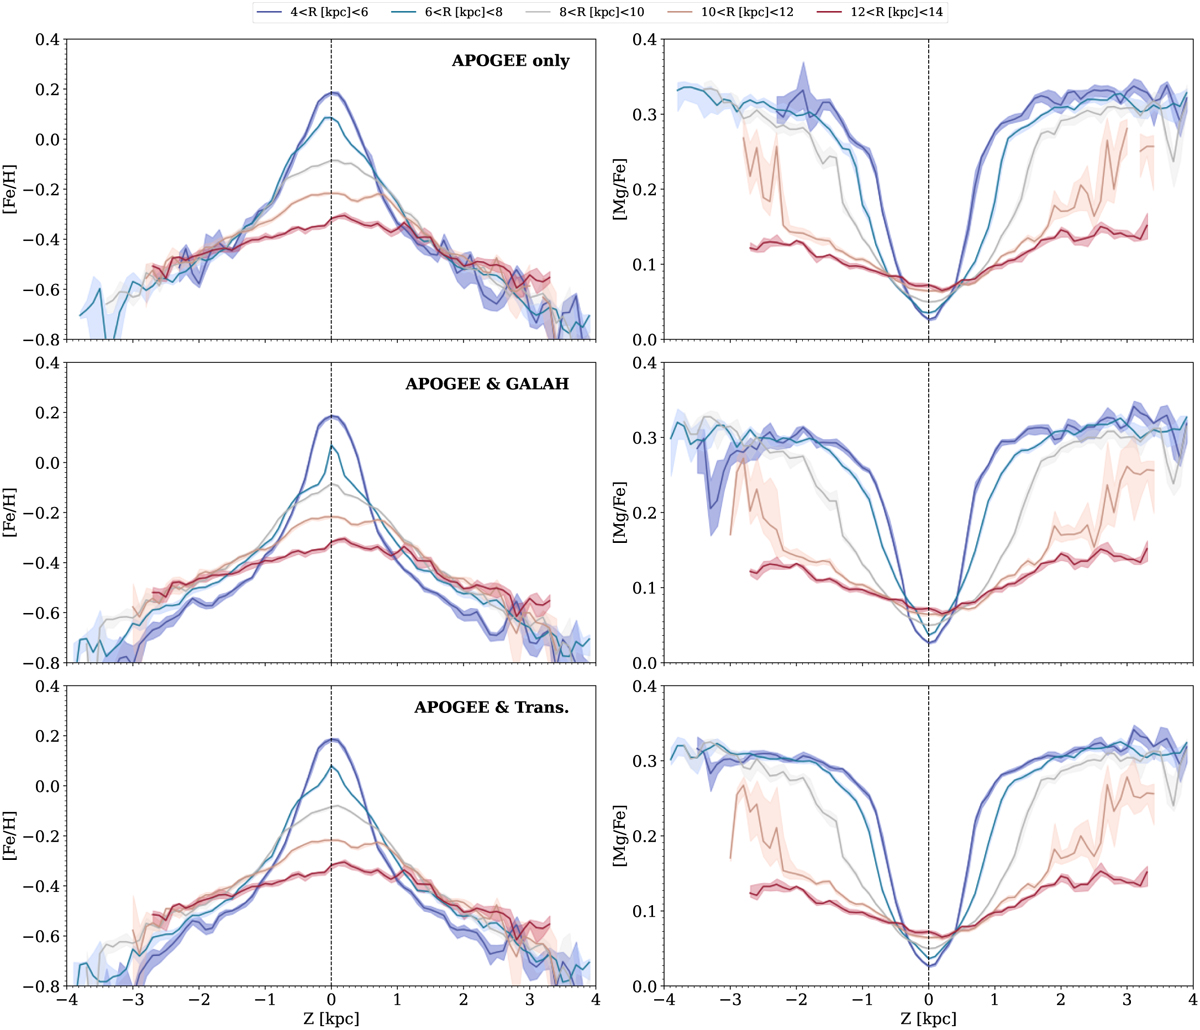
Vertical gradients of the metallicity (left panel) and [Mg/Fe] (right panel) for different radial distance from the Galactic centre. The upper row shows the profile using only the APOGEE-2 data, the middle row combining them with the ‘original’ GALAH values, and the lower row combining the APOGEE-2 data with the translated GALAH data. The trends are computed as running medians in bins of 0.2 kpc, with a 50% overlap, provided that at least 20 stars are available to compute the median. The shaded areas represent the uncertainty on the median (obtained from the 16th and 84th percentile of 1000 bootstrap samples).
Current usage metrics show cumulative count of Article Views (full-text article views including HTML views, PDF and ePub downloads, according to the available data) and Abstracts Views on Vision4Press platform.
Data correspond to usage on the plateform after 2015. The current usage metrics is available 48-96 hours after online publication and is updated daily on week days.
Initial download of the metrics may take a while.