Fig. 17
Download original image
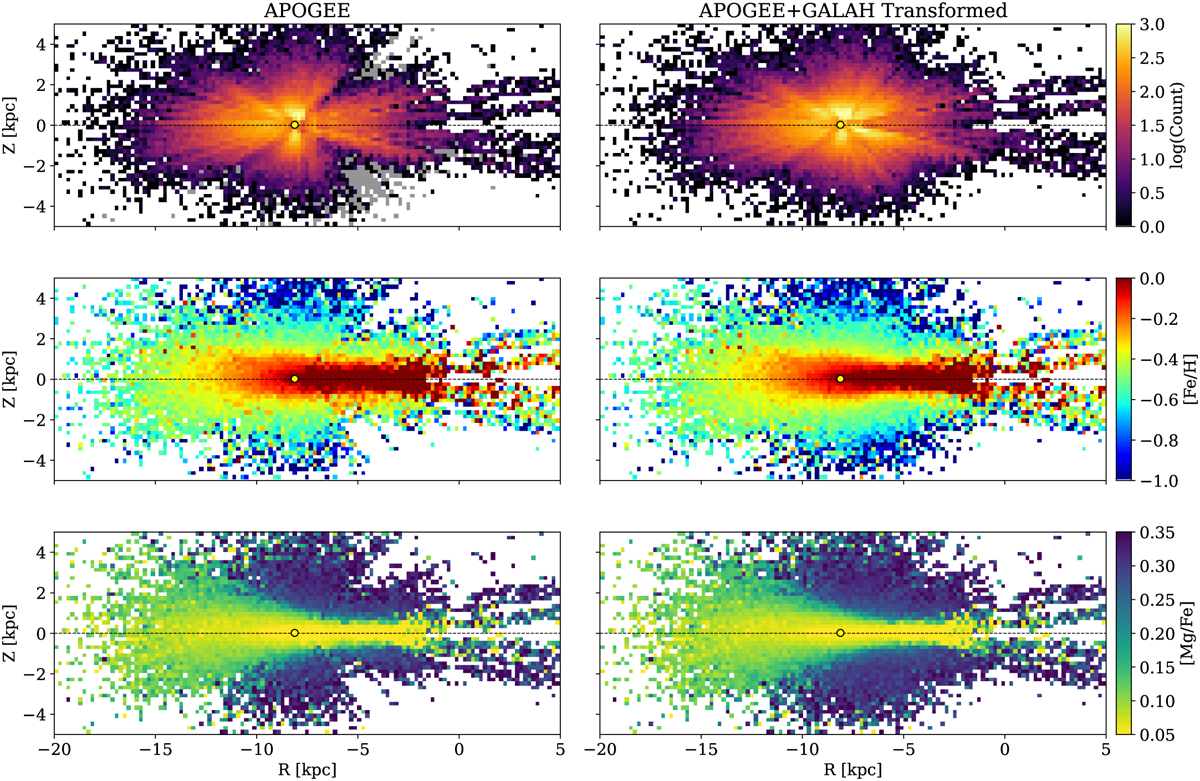
Edge-on view of the global maps of the Milky Way, showing the number of stars observed (upper panels), the median [Fe/H] (middle panels) and median [Mg/Fe] (lower panels) distribution for the APOGEE-2 sample only (left), and combined to the transformed GALAH data (right side) in 0.2 kpc × 0.2 kpc bins. On the upper left panel, the grey area illustrates the region not covered at all by the APOGEE-2 survey, but that has been observed by the GALAH survey. In each panel, the dashed black line shows the Galactic mid-plane, and the yellow circle indicates the location of the Sun. We note that R preserve the sign of the X-axis to show the opposite side of the Galaxy.
Current usage metrics show cumulative count of Article Views (full-text article views including HTML views, PDF and ePub downloads, according to the available data) and Abstracts Views on Vision4Press platform.
Data correspond to usage on the plateform after 2015. The current usage metrics is available 48-96 hours after online publication and is updated daily on week days.
Initial download of the metrics may take a while.