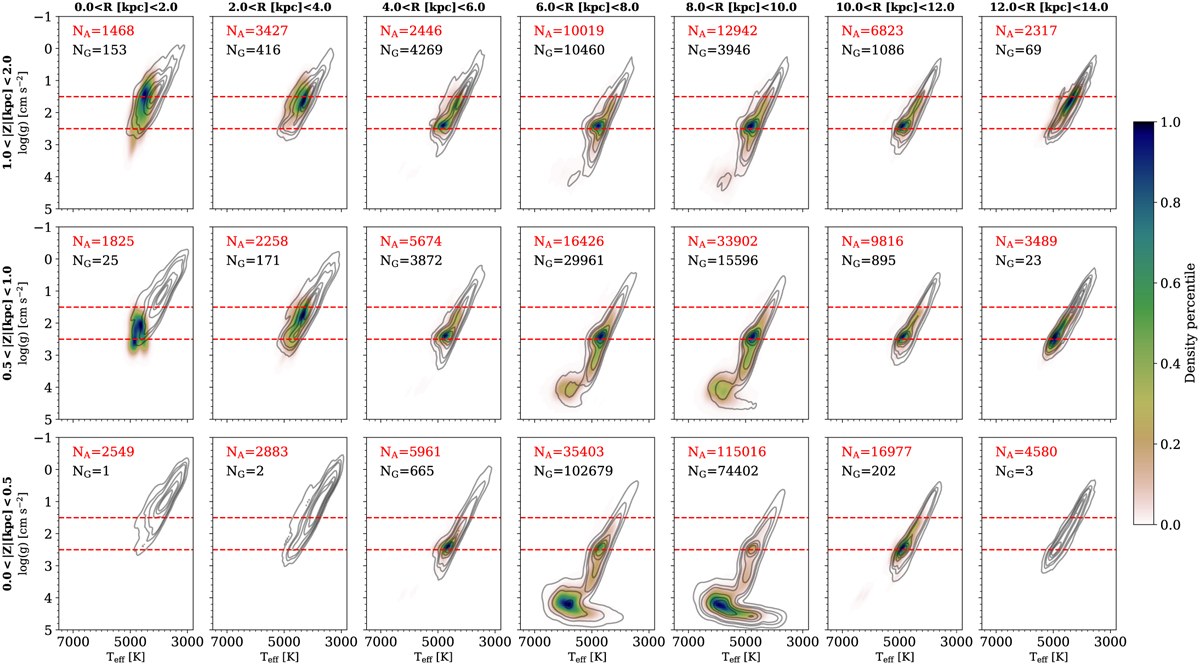
Fig. 15
Download original image
Kiel diagram for different ranges of Galactocentric radii and vertical elevations from the midplane. The 2D histogram shows the relative distribution (made with a kernel density estimator) of the transformed GALAH data in each spatial bin. The grey iso-density contours are plotted at the 1, 5, 10, 30, 50, and 70% of the maximum density for the stars from APOGEE-2. In each bin, NG and NA refer to the number of stars from the GALAH and APOGEE catalogues, respectively. The horizontal dashed red lines show the upper and lower limit for the selection of giant stars used in Sect. 4.
Current usage metrics show cumulative count of Article Views (full-text article views including HTML views, PDF and ePub downloads, according to the available data) and Abstracts Views on Vision4Press platform.
Data correspond to usage on the plateform after 2015. The current usage metrics is available 48-96 hours after online publication and is updated daily on week days.
Initial download of the metrics may take a while.