Fig. 12
Download original image
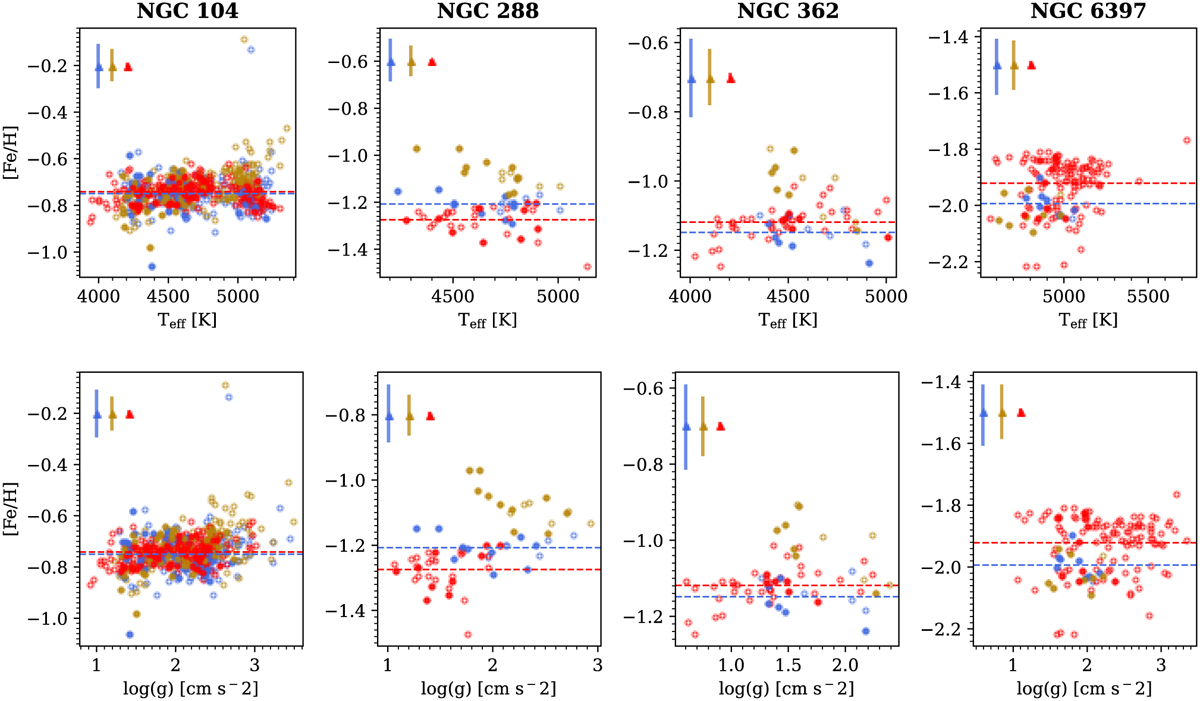
[Fe/H] as function of the effective temperature (top row) and surface gravity (lower row) for 4 globular clusters. The parameters from the “original” GALAH data are shown by the orange points, while the value transformed on the APOGEE-2 base by the SPECTROTRANSLATOR are shown by the blue circles. The red points show the values for the stars present in the APOGEE-2 DR17 dataset. The filled circles highlight the stars observed by both APOGEE-2 and GALAH, while the open circles show the stars that have been observed either by APOGEE-2 or GALAH. The colourised triangles with the error bars indicate the average uncertainties on the individual [Fe/H] measurements in the corresponding catalogue. The horizontal red and blue lines indicates the mean metallicity of the cluster measured using the ‘original’ APOGEE-2 and transformed GALAH values, respectively.
Current usage metrics show cumulative count of Article Views (full-text article views including HTML views, PDF and ePub downloads, according to the available data) and Abstracts Views on Vision4Press platform.
Data correspond to usage on the plateform after 2015. The current usage metrics is available 48-96 hours after online publication and is updated daily on week days.
Initial download of the metrics may take a while.