Fig. 10
Download original image
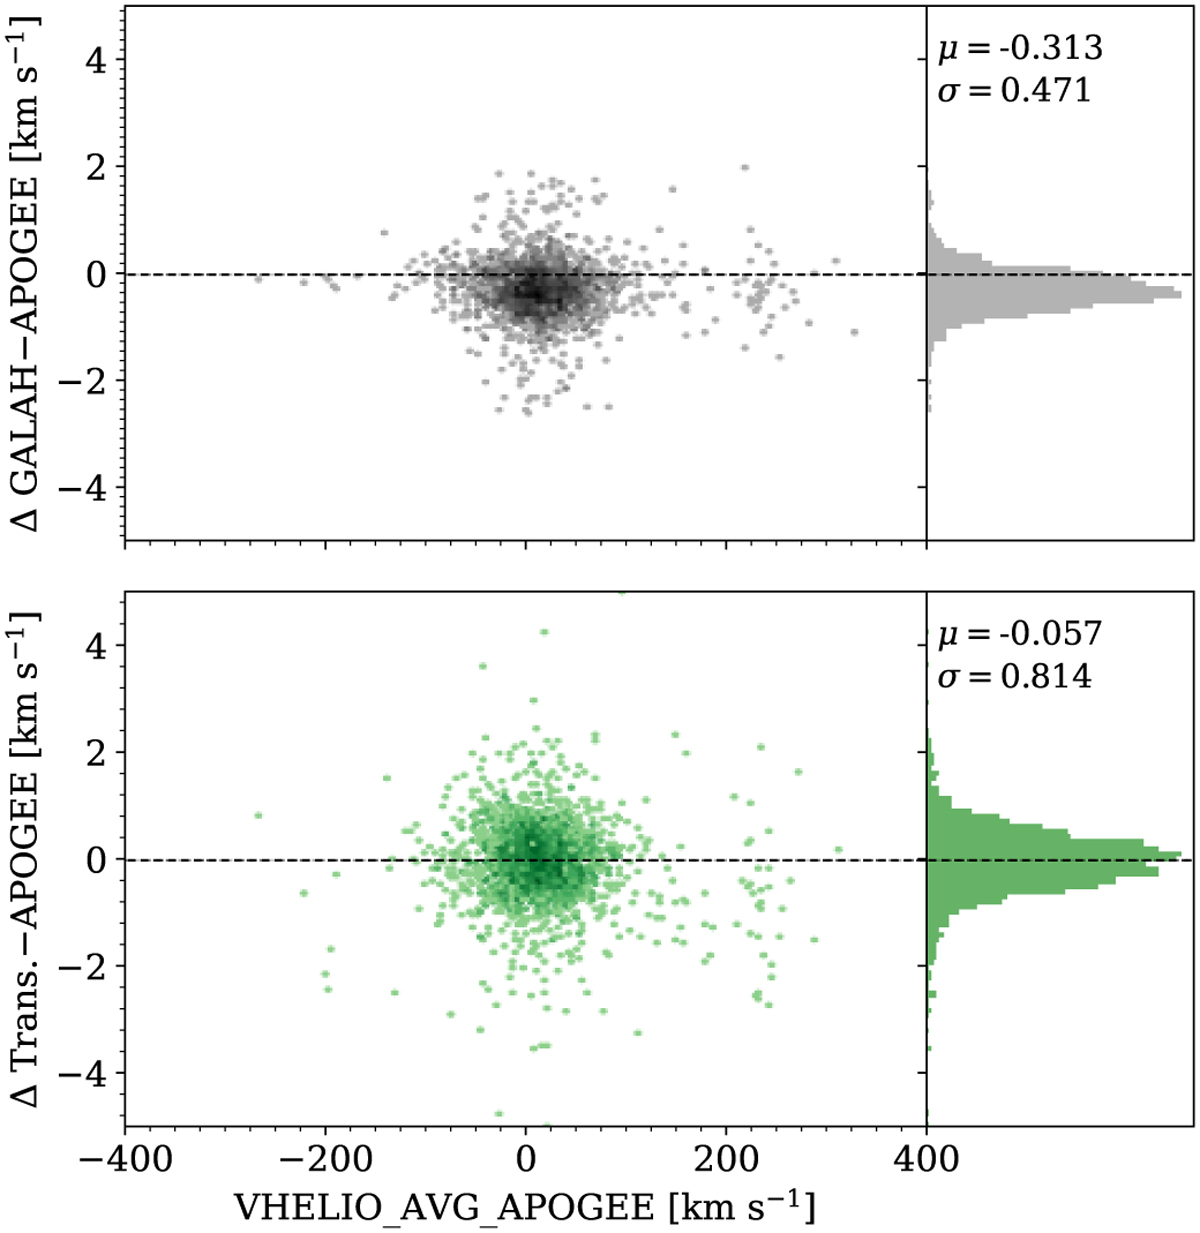
Comparison between the difference of the l.o.s. velocity measured by GALAH and APOGEE-2 on the top panel, as well as the difference of the velocity transformed by the SPECTROTRANSLATOR algorithm and the APOGEE-2 data on the bottom panel, as a function of the l.o.s velocity measured by APOGEE-2. In both cases, the symbols show the stars of the training set. The histograms on the right panels show the distribution of the difference between the l.o.s. velocity measured by GALAH and APOGEE-2 (on top) and between the transformed GALAH l.o.s and the “original” APOGEE-2 values.
Current usage metrics show cumulative count of Article Views (full-text article views including HTML views, PDF and ePub downloads, according to the available data) and Abstracts Views on Vision4Press platform.
Data correspond to usage on the plateform after 2015. The current usage metrics is available 48-96 hours after online publication and is updated daily on week days.
Initial download of the metrics may take a while.