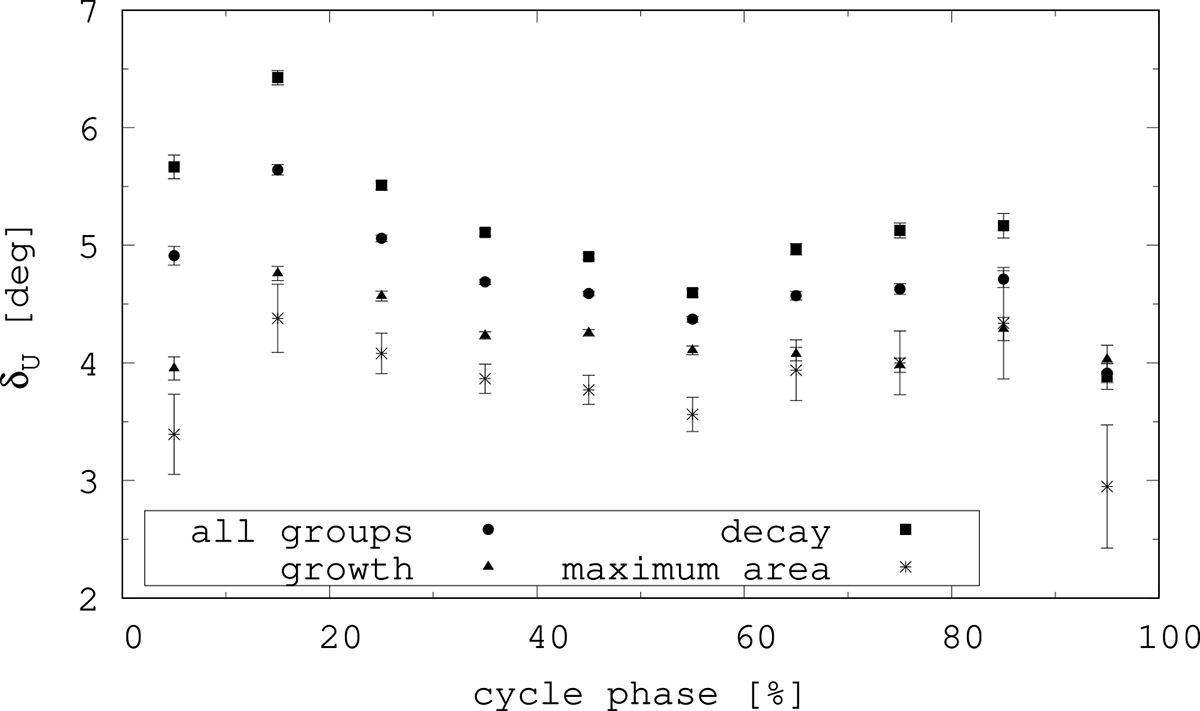
Fig. 6.
Download original image
Separation distance versus cycle phase by using the SDD. The separation distances are averaged over 10% cycle phase bins and plotted to the center of each bin. The mean separation distance is calculated for the entire group (plotted by dots), their growth phase (triangles), maxima (asterisk), and decay (squares). The error bars mark the standard errors.
Current usage metrics show cumulative count of Article Views (full-text article views including HTML views, PDF and ePub downloads, according to the available data) and Abstracts Views on Vision4Press platform.
Data correspond to usage on the plateform after 2015. The current usage metrics is available 48-96 hours after online publication and is updated daily on week days.
Initial download of the metrics may take a while.