Fig. 4.
Download original image
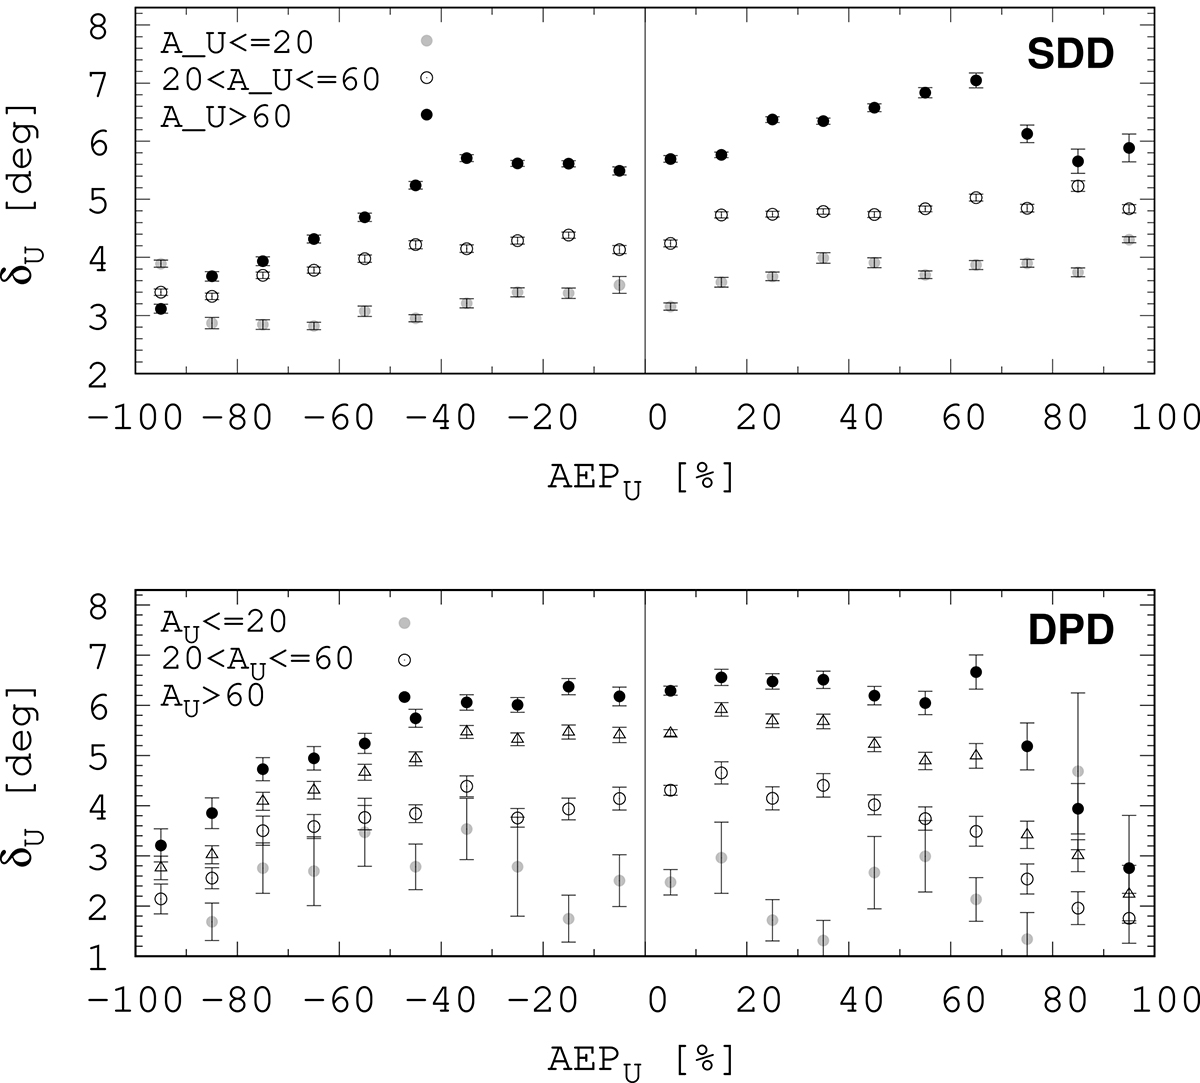
Separation distance as a function of AEPU for three sets of sunspot groups considering their peak umbral area. The top panel concerns the SDD, the bottom panel concerns the DPD. The empty triangles mark the data calculated on the entire sample of the DPD (same as in Figure 3 for the SDD). The separation distances are averaged over 10% bins of the AEP, the error bars mark the standard error.
Current usage metrics show cumulative count of Article Views (full-text article views including HTML views, PDF and ePub downloads, according to the available data) and Abstracts Views on Vision4Press platform.
Data correspond to usage on the plateform after 2015. The current usage metrics is available 48-96 hours after online publication and is updated daily on week days.
Initial download of the metrics may take a while.