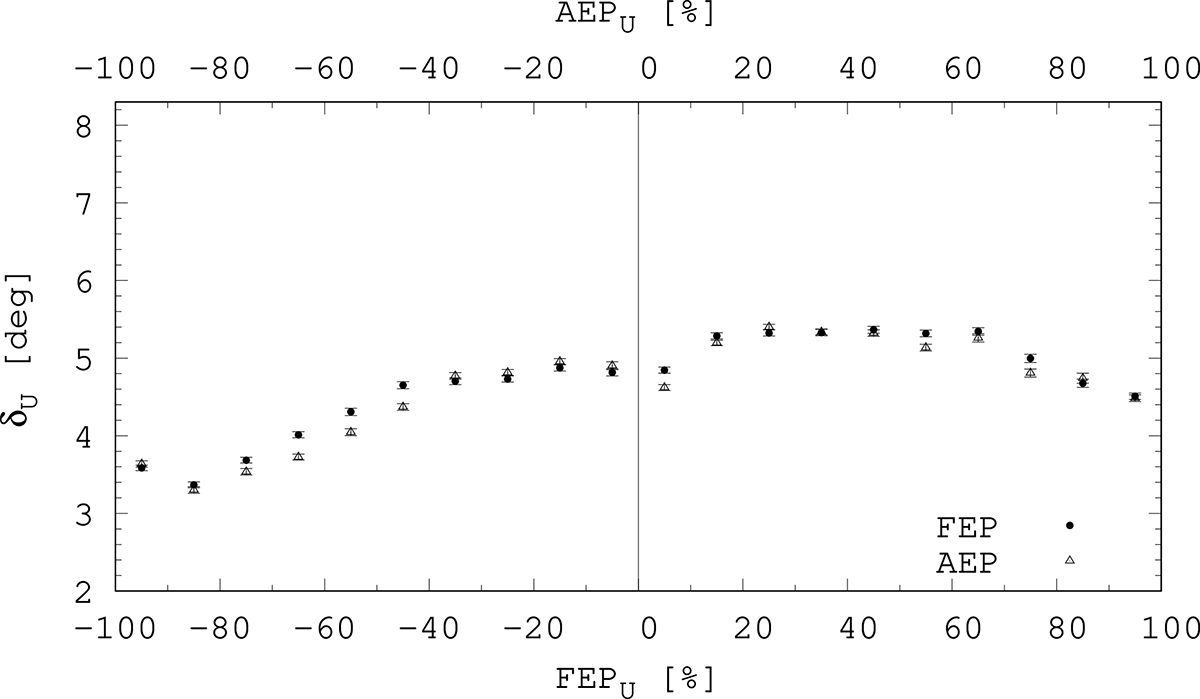
Fig. 3.
Download original image
Spherical leading-following distance vs. FEP (measured on the bottom axis) plotted with black dots and AEP (measured on the top axis) depicted by empty triangles. The mean values of separation distance with their standard errors are averaged over 10% bins of the umbral FEP (AEP). The data reported in this figure come from the SDD.
Current usage metrics show cumulative count of Article Views (full-text article views including HTML views, PDF and ePub downloads, according to the available data) and Abstracts Views on Vision4Press platform.
Data correspond to usage on the plateform after 2015. The current usage metrics is available 48-96 hours after online publication and is updated daily on week days.
Initial download of the metrics may take a while.