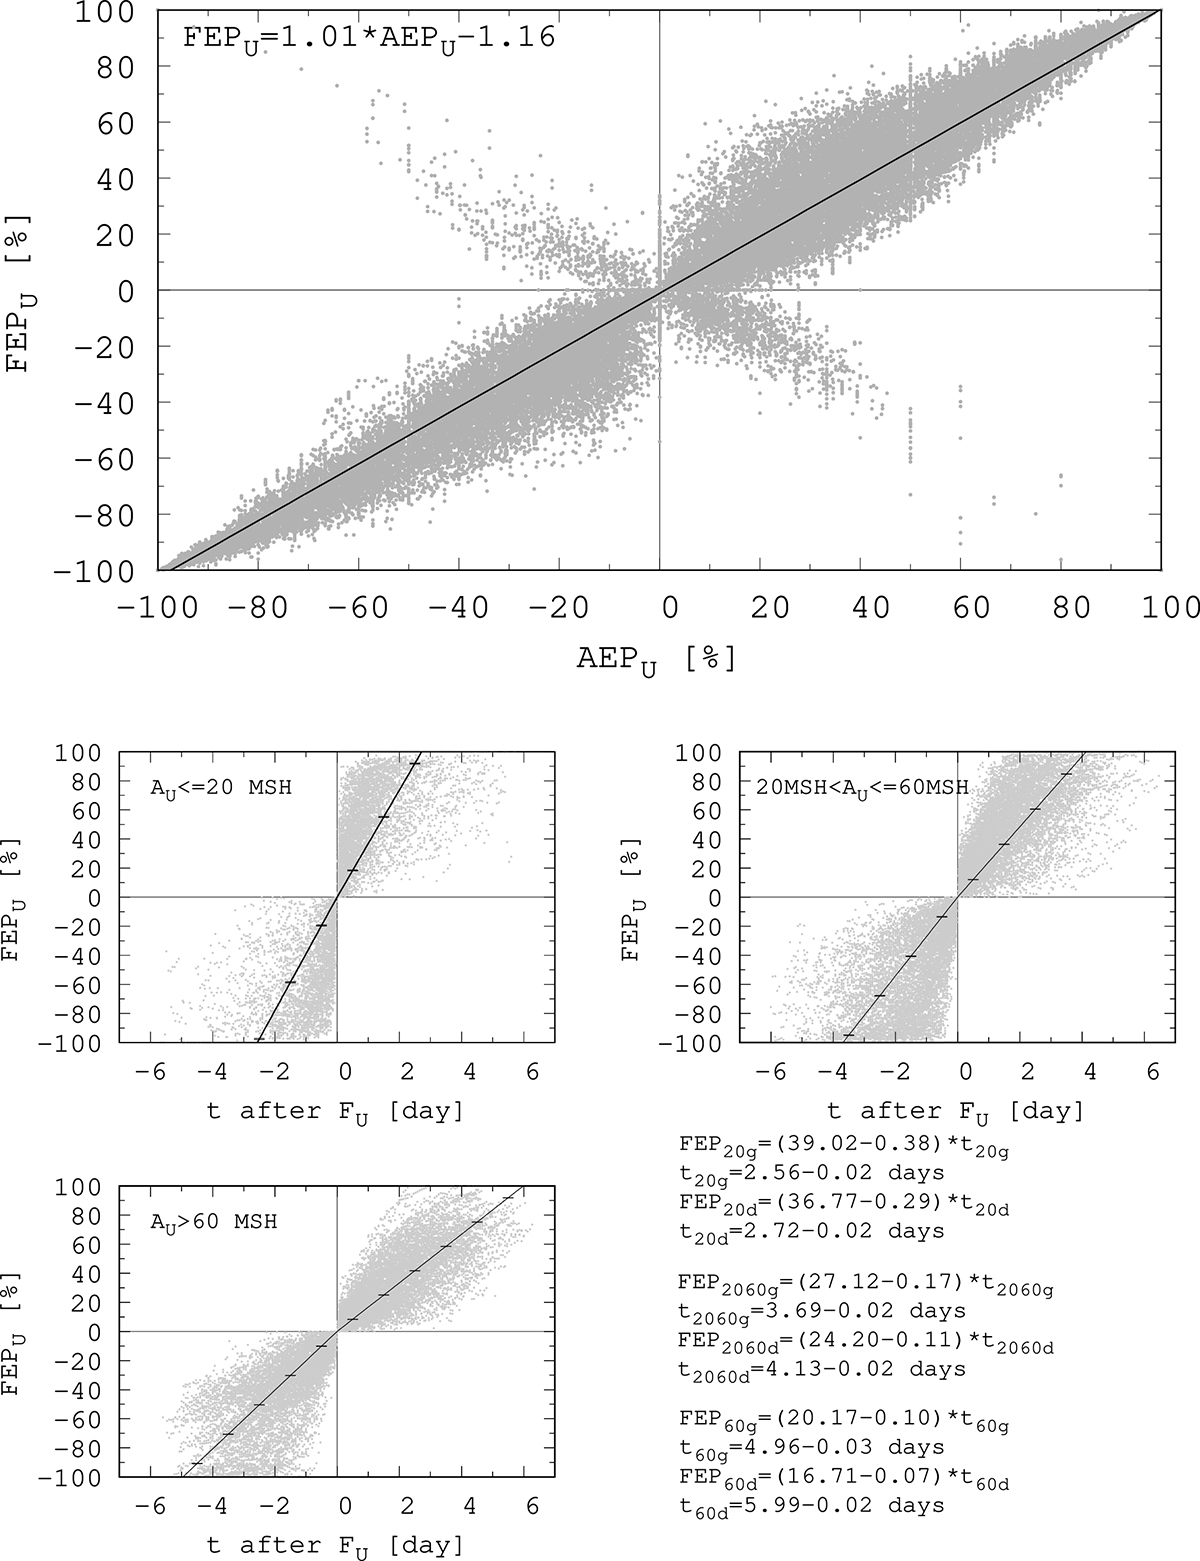
Fig. 2.
Download original image
Relationship of the area evolution phase and total unsigned flux evolution phase based on the SDD (top panel). Both of them are measured in percentage. Each gray point marks a sunspot group in one observation time. The linear fitted function is depicted with solid black line, its equation can be found in the upper left quadrant. Bottom panel: Umbral flux evolution phase as a function of time near the time of maximum flux measured in days for three sets of sunspot group sizes. The equations of the fitted regression lines and standard error values can be found in the bottom right quarter. The characters g and d mean the growth (negative values) and decay (positive values) phases of groups. The average growth and decay periods are calculated by using the equations of the fitted functions.
Current usage metrics show cumulative count of Article Views (full-text article views including HTML views, PDF and ePub downloads, according to the available data) and Abstracts Views on Vision4Press platform.
Data correspond to usage on the plateform after 2015. The current usage metrics is available 48-96 hours after online publication and is updated daily on week days.
Initial download of the metrics may take a while.