Fig. 8.
Download original image
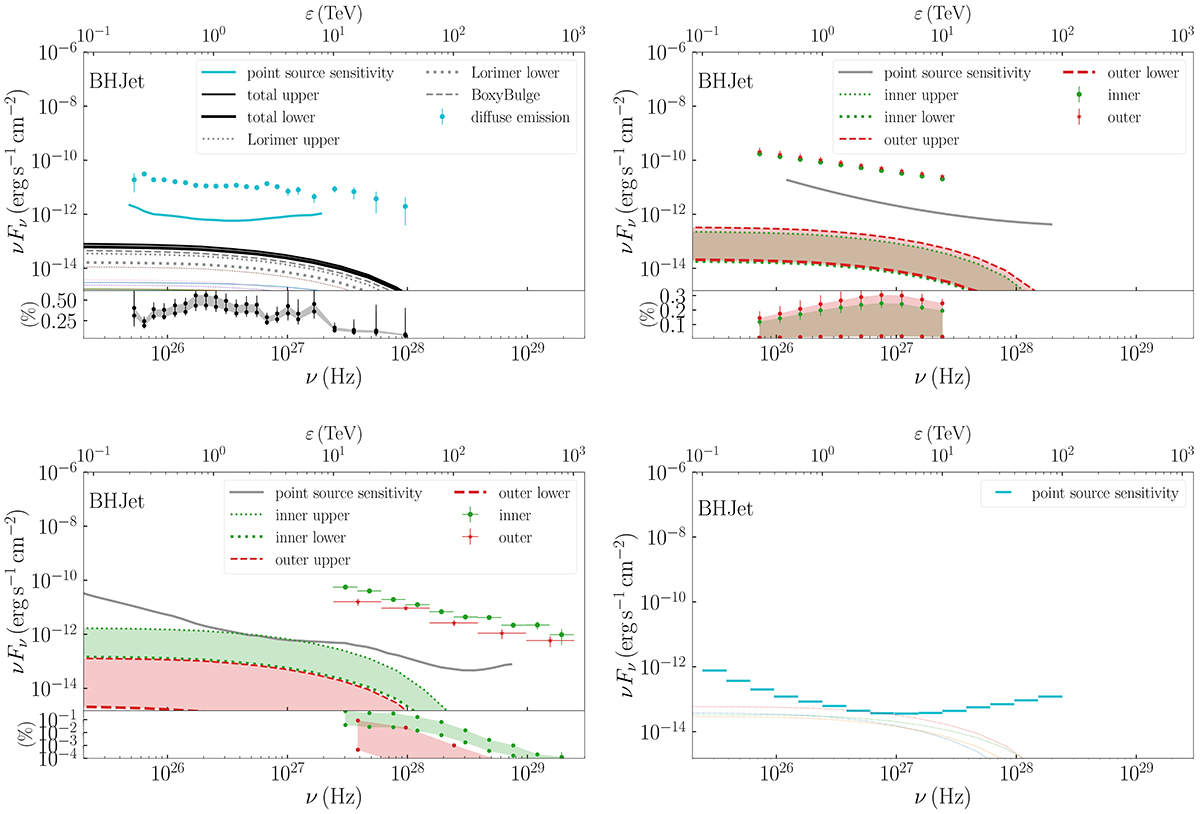
Similar to Fig. 5, but for the highest-energy regime of TeV compared to the H.E.S.S. (top left), HAWC (top right), LHAASO (bottom left), and CTAO (bottom right) facilities. For H.E.S.S., HAWC, and LHAASO, we show with solid coloured lines the individual sources that exceed 10−3 of the point source sensitivity, and for CTAO, we show the sources that exceed one-third of the predicted point source sensitivity. For all panels, we only show the case of BHJet because the contribution of sources that follow MLJet is even smaller than pictured here. The inner (outer) region for the case of HAWC is 43° ≤l ≤ 73° and |b|≤2° (|b|≤4°), and the inner (outer) region for the case of LHAASO is 15° ≤l ≤ 125° (125° ≤l ≤ 235°) and |b|≤5°. For CTAO, the sources lie within |l|≤60° and |b|≤3° (Eckner et al. 2023). All the panels have the same axes for comparison.
Current usage metrics show cumulative count of Article Views (full-text article views including HTML views, PDF and ePub downloads, according to the available data) and Abstracts Views on Vision4Press platform.
Data correspond to usage on the plateform after 2015. The current usage metrics is available 48-96 hours after online publication and is updated daily on week days.
Initial download of the metrics may take a while.