Fig. 5.
Download original image
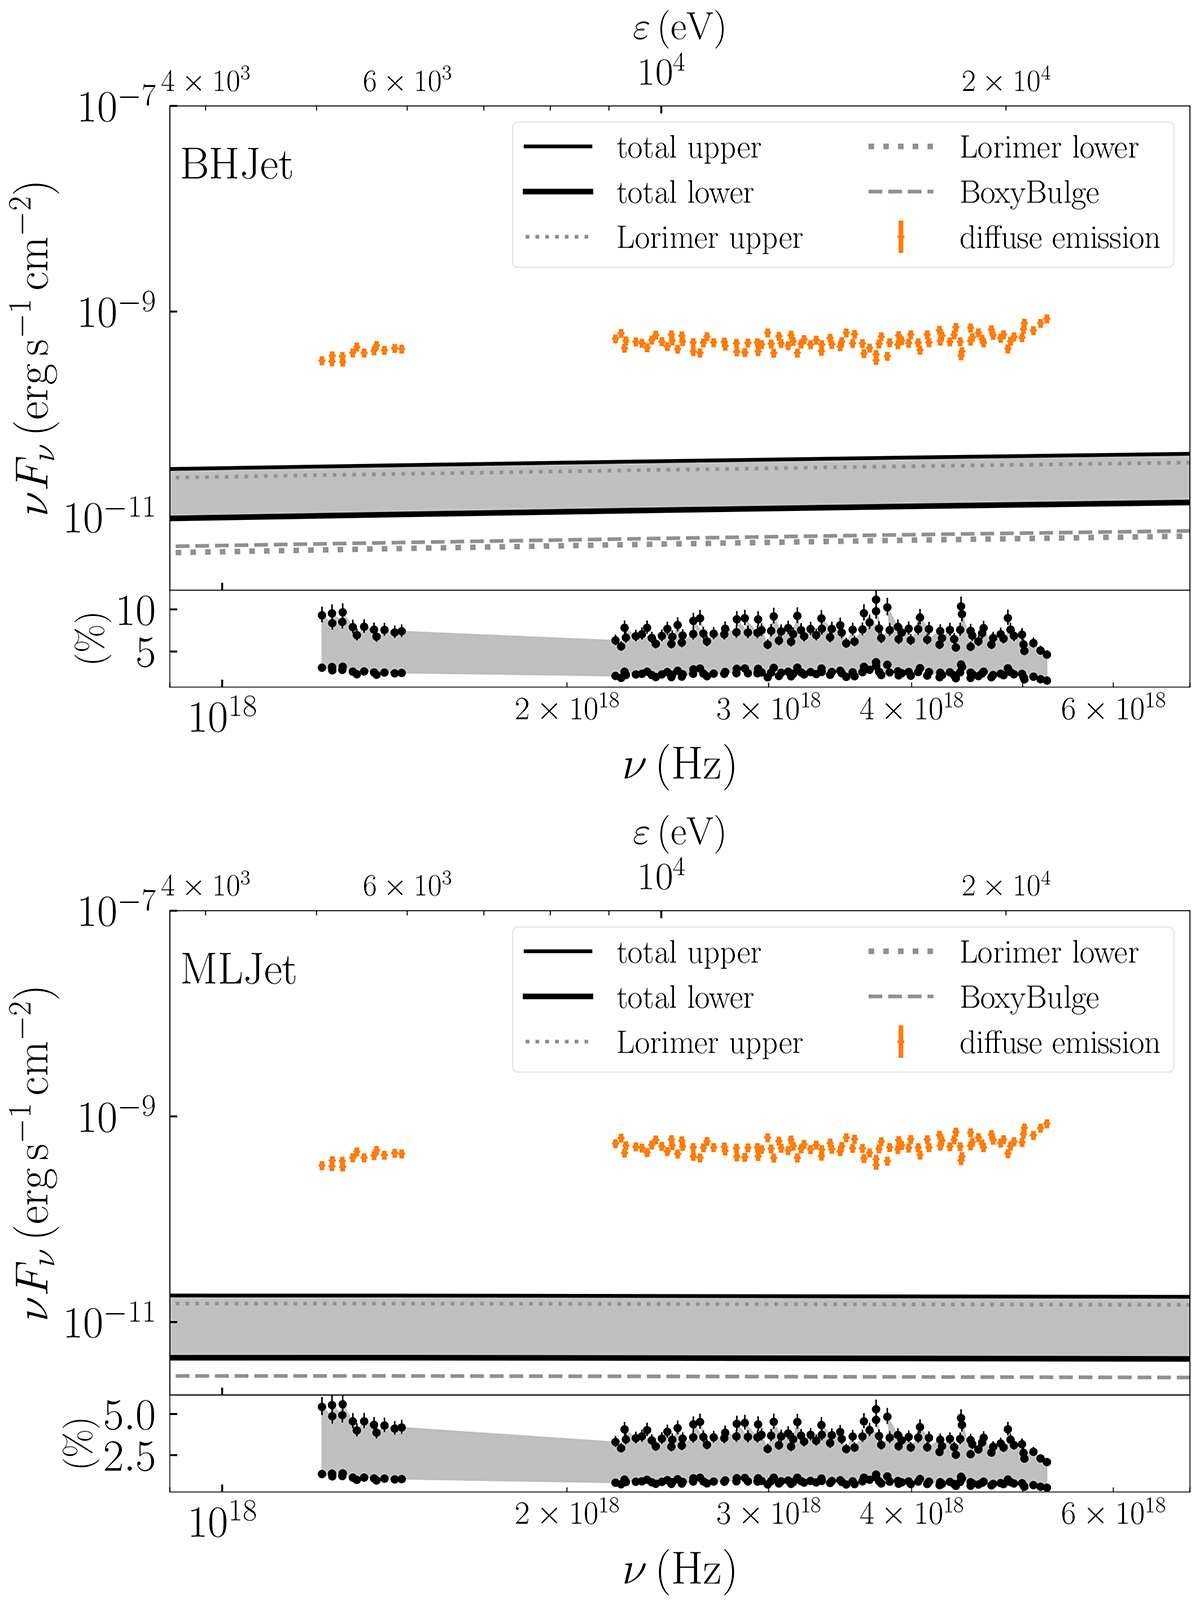
Contribution of the prompt emission of the Galactic qBHXBs to the NuSTAR diffuse emission for 1° ≤(l, b)≤3° (Perez et al. 2019). The upper panel shows the assumed model BHJet, and the lower panel shows the MLJet. In both panels, we show the lower and upper limit of the Lorimer-like distribution (1.2 × 10⁴ versus 1.2 × 10⁵ qBHXBs) and the 103 boxy bulge-like sources based on Olejak et al. (2020). The sum of the boxy bulge and the Lorimer-like distribution leads to the total contribution, which we plot with the thin solid line for the upper limit and the thick solid line for the lower limit. The shaded grey region corresponds to the predicted contribution of these qBHXBs to the observed diffuse emission. The insets in both panels show the percentage contribution per energy bin.
Current usage metrics show cumulative count of Article Views (full-text article views including HTML views, PDF and ePub downloads, according to the available data) and Abstracts Views on Vision4Press platform.
Data correspond to usage on the plateform after 2015. The current usage metrics is available 48-96 hours after online publication and is updated daily on week days.
Initial download of the metrics may take a while.