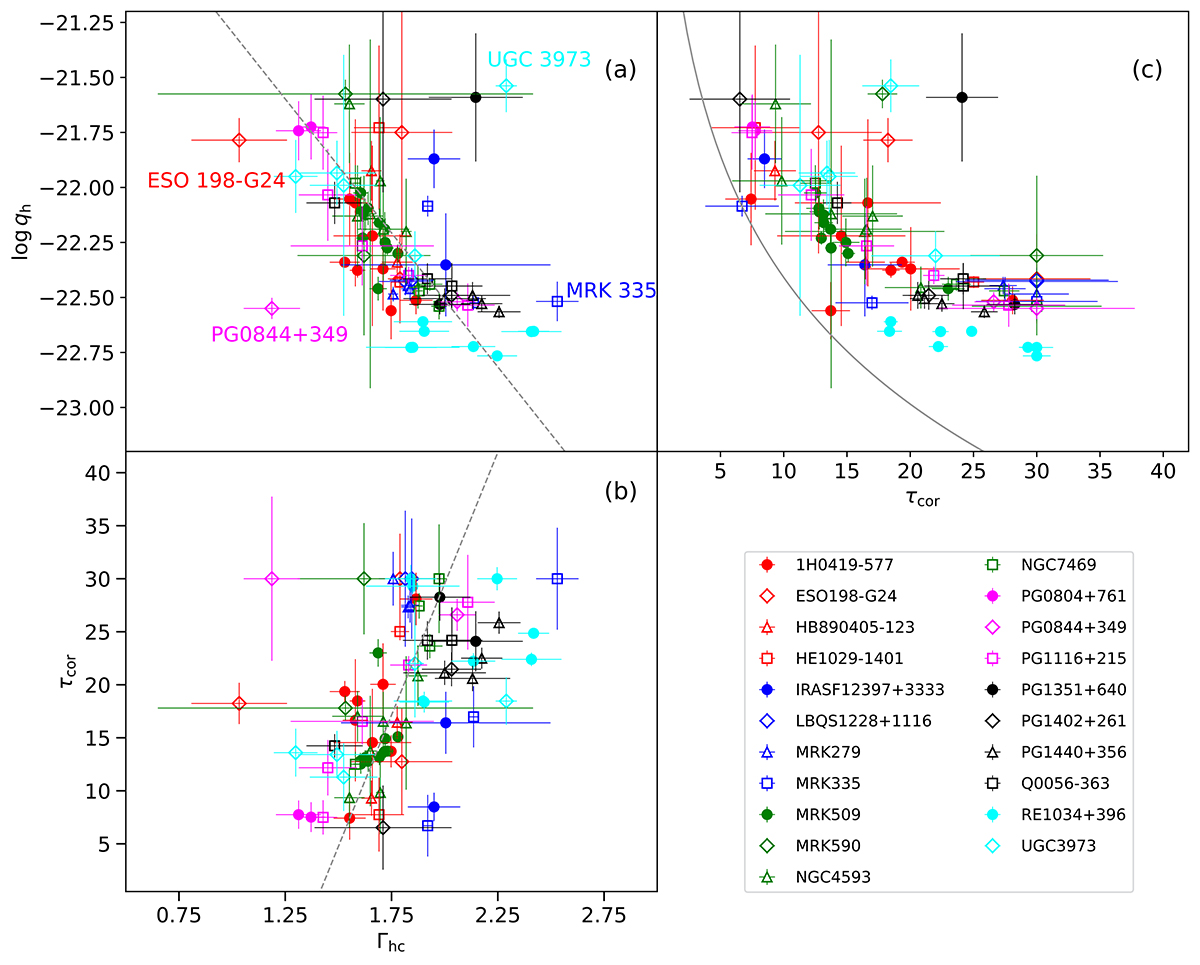
Fig. 6.
Download original image
Scatter plots showing the relationship between internal heating (log qh) inside warm corona with hot corona spectral index Γhc (a), optical depth (τcor) of warm corona with Γhc (b), and variation of log qh vs. τcor (c). The best fit linear regression is indicated by a grey dashed line. The grey solid curve in the top-right panel corresponds to χ = 1 (Eq. (5)), marking the boundary between active χ < 1, and passive disk with χ > 1. Different symbols associated with sources are given in the bottom right.
Current usage metrics show cumulative count of Article Views (full-text article views including HTML views, PDF and ePub downloads, according to the available data) and Abstracts Views on Vision4Press platform.
Data correspond to usage on the plateform after 2015. The current usage metrics is available 48-96 hours after online publication and is updated daily on week days.
Initial download of the metrics may take a while.