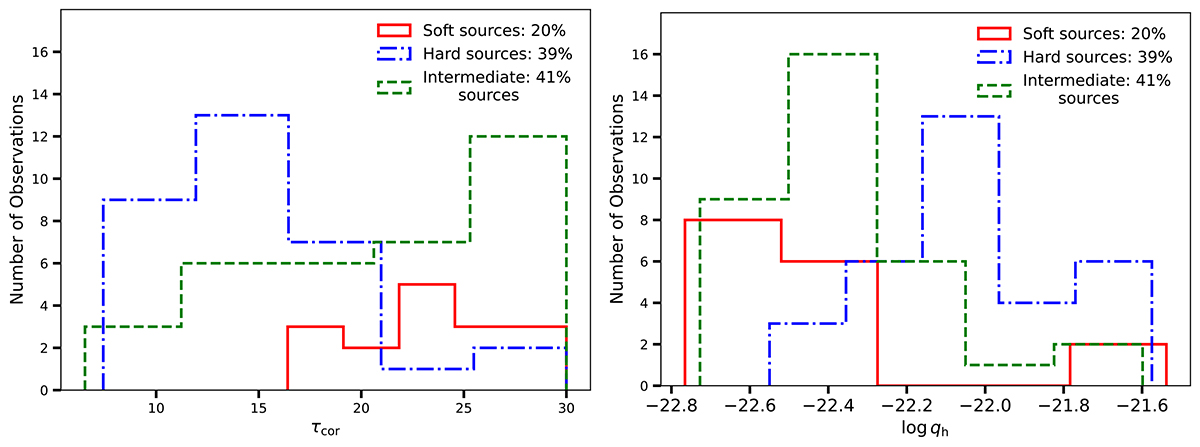
Fig. 5.
Download original image
Distribution of the warm corona optical depth, τcor (left), and internal heating, log qh (right), from fitting the total model described in Sect. 4. Blue histogram denotes sources with Γhc ≤ 1.7, red – Γhc ≥ 2 (soft) and the rest are denoted by green. The percentages denote the fraction of the total sample consisting of soft, hard, or intermediate-type sources.
Current usage metrics show cumulative count of Article Views (full-text article views including HTML views, PDF and ePub downloads, according to the available data) and Abstracts Views on Vision4Press platform.
Data correspond to usage on the plateform after 2015. The current usage metrics is available 48-96 hours after online publication and is updated daily on week days.
Initial download of the metrics may take a while.