Fig. 3.
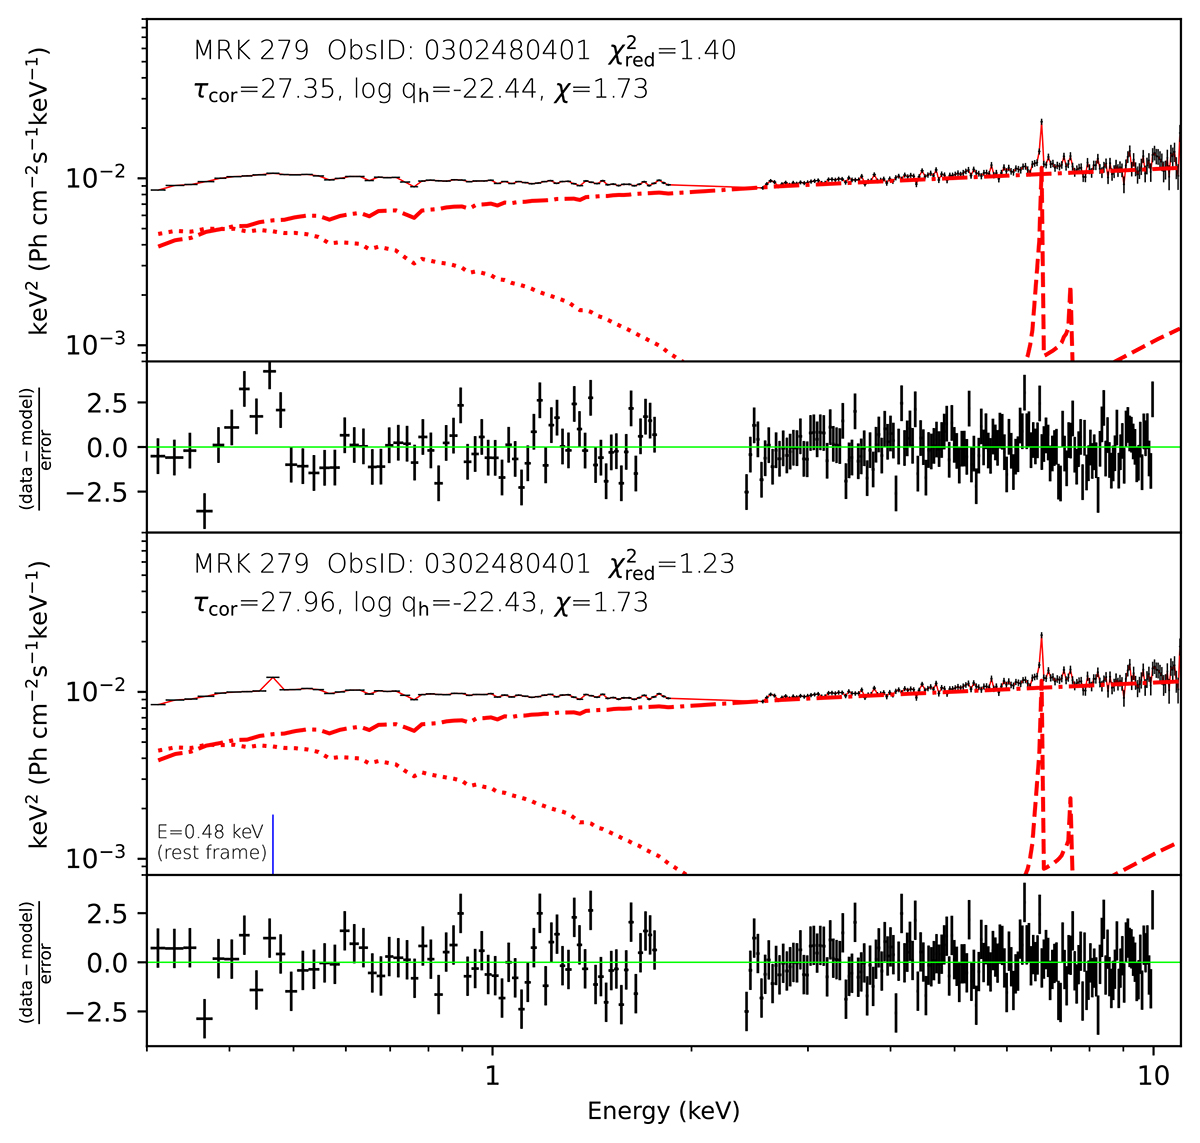
Download original image
Spectral model decomposition of MRK 279 data set with ObsID: 0302480401 fitted with our basic model given by Eq. (7) – upper panel and the same model with one narrow Gaussian added – lower panel. Adding one narrow line allowed us to improve the fit statistics without affecting the warm corona marked by a dotted, red line. NTHCOMP component is presented by the dotted-dashed red line, XILLVER is shown by the dashed red line, while observations are given by black crosses. For each case, the ratio of data to the folded model is plotted below.
Current usage metrics show cumulative count of Article Views (full-text article views including HTML views, PDF and ePub downloads, according to the available data) and Abstracts Views on Vision4Press platform.
Data correspond to usage on the plateform after 2015. The current usage metrics is available 48-96 hours after online publication and is updated daily on week days.
Initial download of the metrics may take a while.