Open Access
Fig. A.1.
Download original image
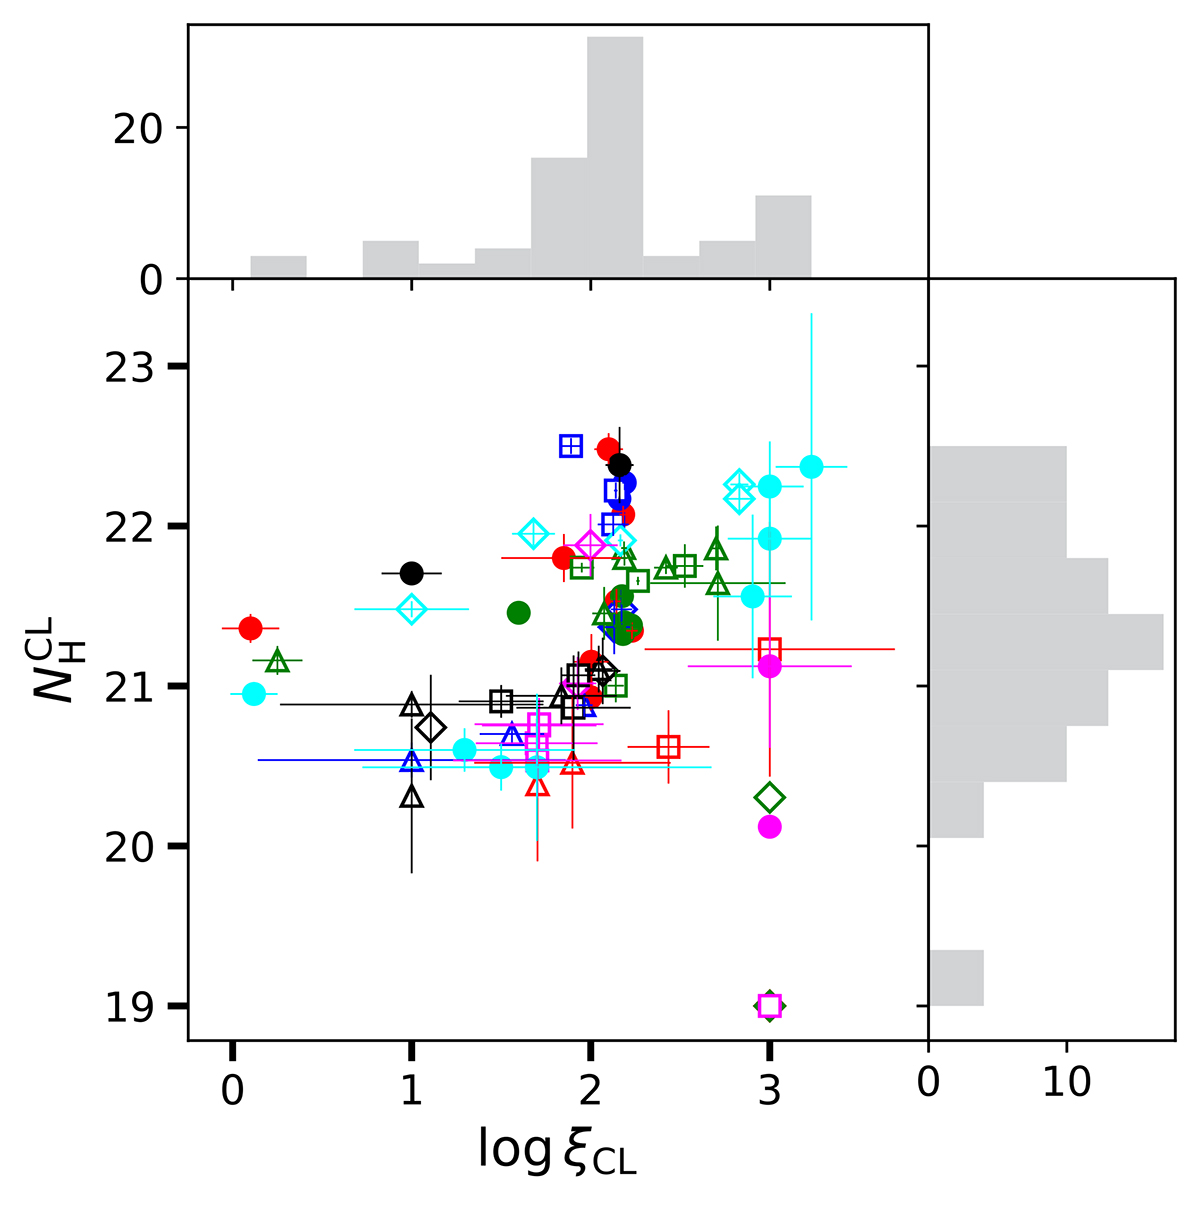
Scatter plot showing the best fitted hydrogen column density, ![]() , against ionization parameter, ξCL, of CLOUDY model. The distribution of their values is shown as grey histograms. Different symbols associated with sources are the same as in Fig. 6.
, against ionization parameter, ξCL, of CLOUDY model. The distribution of their values is shown as grey histograms. Different symbols associated with sources are the same as in Fig. 6.
Current usage metrics show cumulative count of Article Views (full-text article views including HTML views, PDF and ePub downloads, according to the available data) and Abstracts Views on Vision4Press platform.
Data correspond to usage on the plateform after 2015. The current usage metrics is available 48-96 hours after online publication and is updated daily on week days.
Initial download of the metrics may take a while.