Open Access
Fig. 9.
Download original image
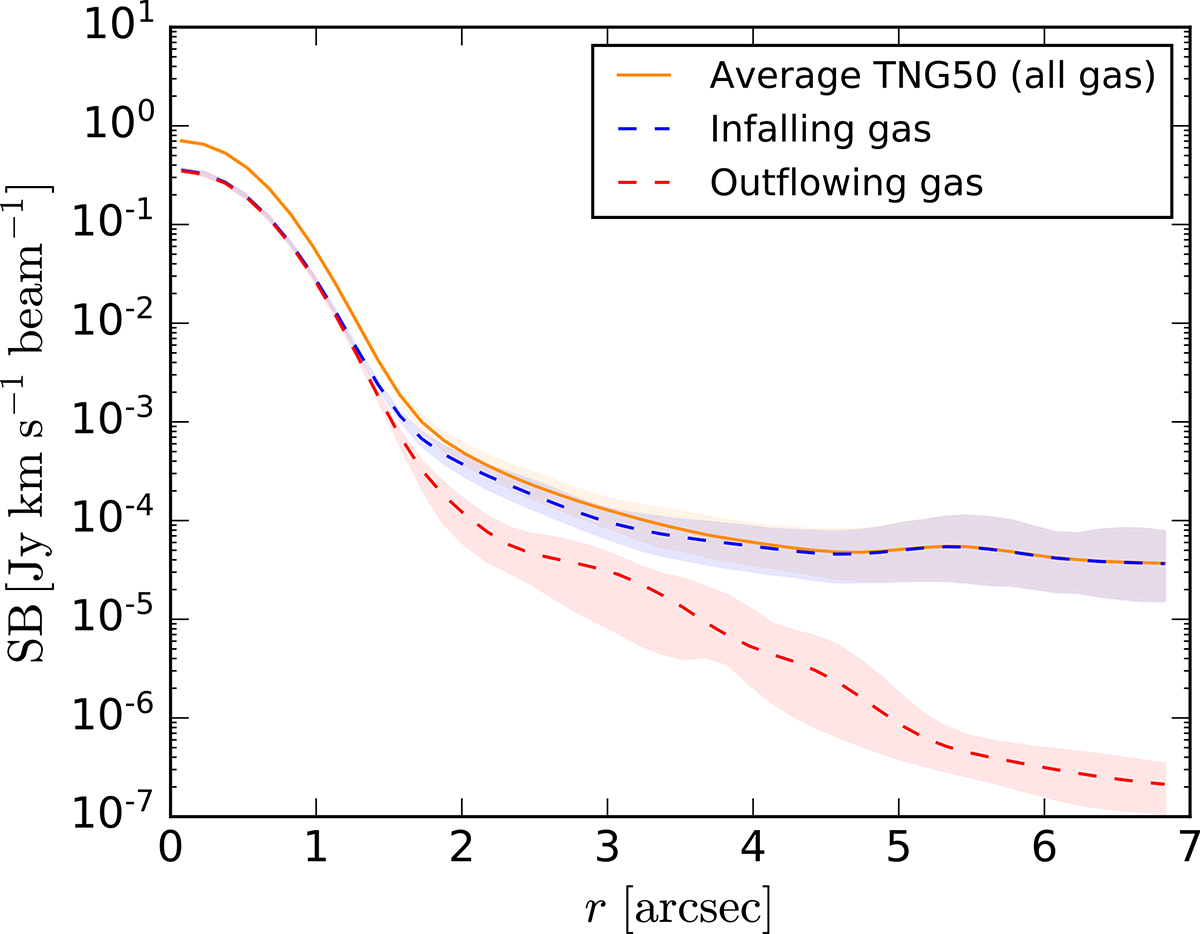
Averaged contribution of the infalling gas (dashed blue line) and outflowing gas (dashed red line) to the total [CII] emitting gas (orange line). The shaded areas represent the 2σ uncertainty obtained using 1000 samples of galaxies with randomly picked orientations, as explained in Sect. 3.4.
Current usage metrics show cumulative count of Article Views (full-text article views including HTML views, PDF and ePub downloads, according to the available data) and Abstracts Views on Vision4Press platform.
Data correspond to usage on the plateform after 2015. The current usage metrics is available 48-96 hours after online publication and is updated daily on week days.
Initial download of the metrics may take a while.