Fig. 7.
Download original image
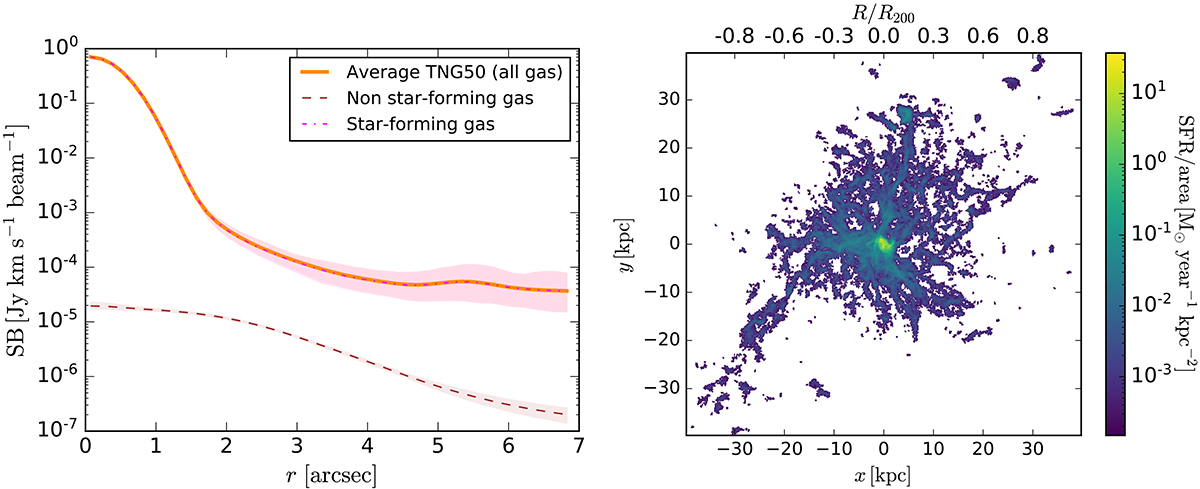
Contribution and distribution of the star-forming gas. Left: Averaged contribution of the star-forming gas (dot-dashed magenta line) and non star-forming gas (dashed brown line) to the total [CII] emitting gas (orange line). The shaded areas enclose 95% of different results obtained by different galaxy orientations. Right: SFR density map for a TNG50 galaxy at z = 5. The box goes out to ∼40 kpc or ∼R200 from the central galaxy.
Current usage metrics show cumulative count of Article Views (full-text article views including HTML views, PDF and ePub downloads, according to the available data) and Abstracts Views on Vision4Press platform.
Data correspond to usage on the plateform after 2015. The current usage metrics is available 48-96 hours after online publication and is updated daily on week days.
Initial download of the metrics may take a while.