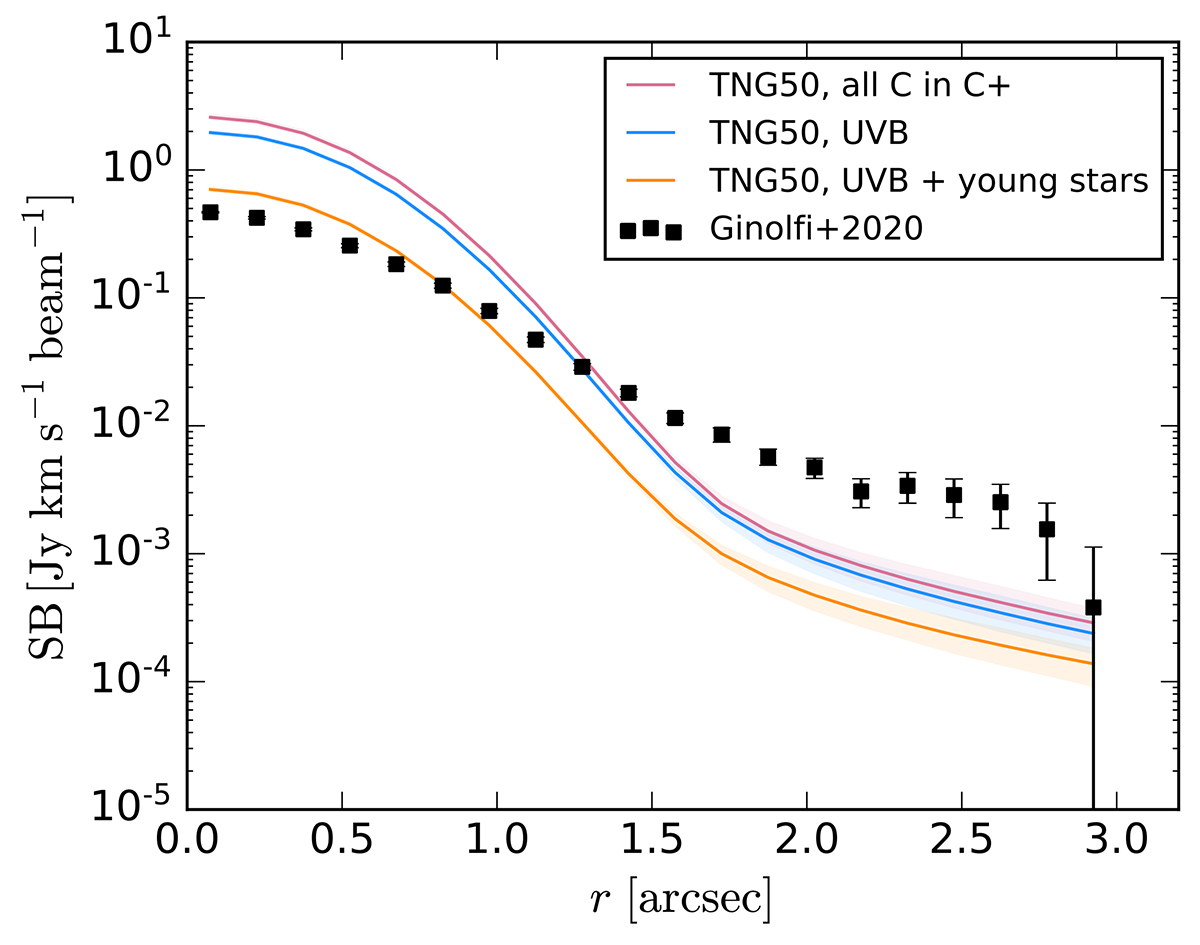
Fig. 6.
Download original image
Averaged [CII] SB profiles obtained for our sample of 72 TNG50 galaxies at z = 4, 5, and 6 (solid lines), with shaded areas enclosing a 95% of different results obtained by different galaxy orientations. The different line colors represent the TNG50 profiles obtained assuming C+ abundances equal to the total C abundance (dark pink), C+ abundance obtained considering the UVB as incident field (light blue) and C+ abundance considering UVB and local young stars as ionization sources (orange). As a comparison, the black squares represent the results from the ALPINE survey.
Current usage metrics show cumulative count of Article Views (full-text article views including HTML views, PDF and ePub downloads, according to the available data) and Abstracts Views on Vision4Press platform.
Data correspond to usage on the plateform after 2015. The current usage metrics is available 48-96 hours after online publication and is updated daily on week days.
Initial download of the metrics may take a while.