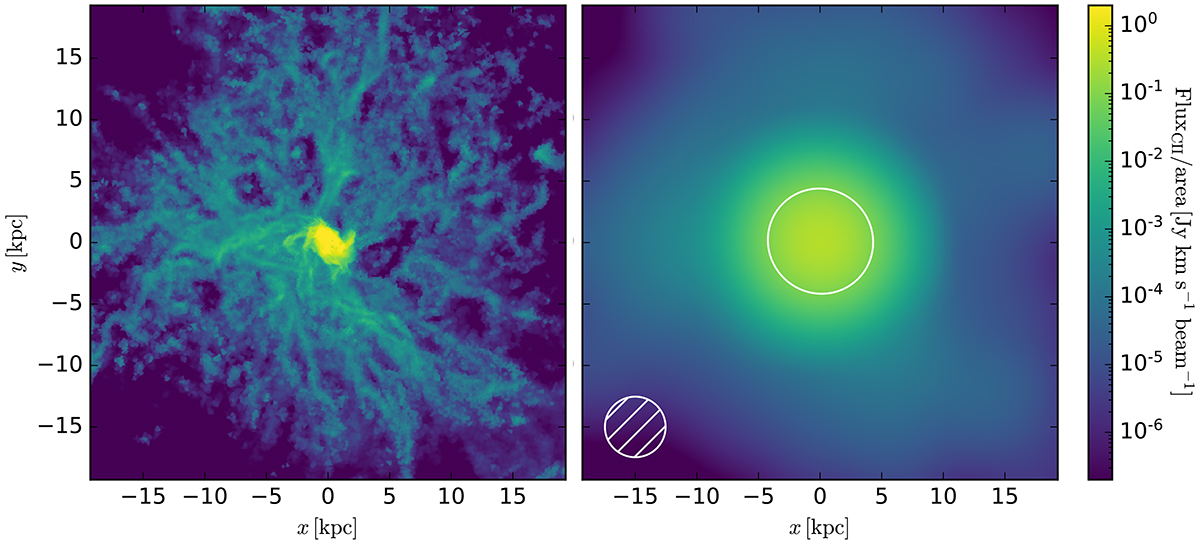
Fig. 4.
Download original image
[CII] emission surface-brightness map for one of the selected TNG50 galaxies at z = 5, assuming C+ abundances with UVB and local young stars as ionization sources. Left: the map is presented at the full-resolution of the simulation. Right: the map has been convolved with the average ALMA beam of the G20 observations (bottom left corner). The white contour represents the average 2σ level of the observations (0.08 Jy km s−1 beam−1).
Current usage metrics show cumulative count of Article Views (full-text article views including HTML views, PDF and ePub downloads, according to the available data) and Abstracts Views on Vision4Press platform.
Data correspond to usage on the plateform after 2015. The current usage metrics is available 48-96 hours after online publication and is updated daily on week days.
Initial download of the metrics may take a while.