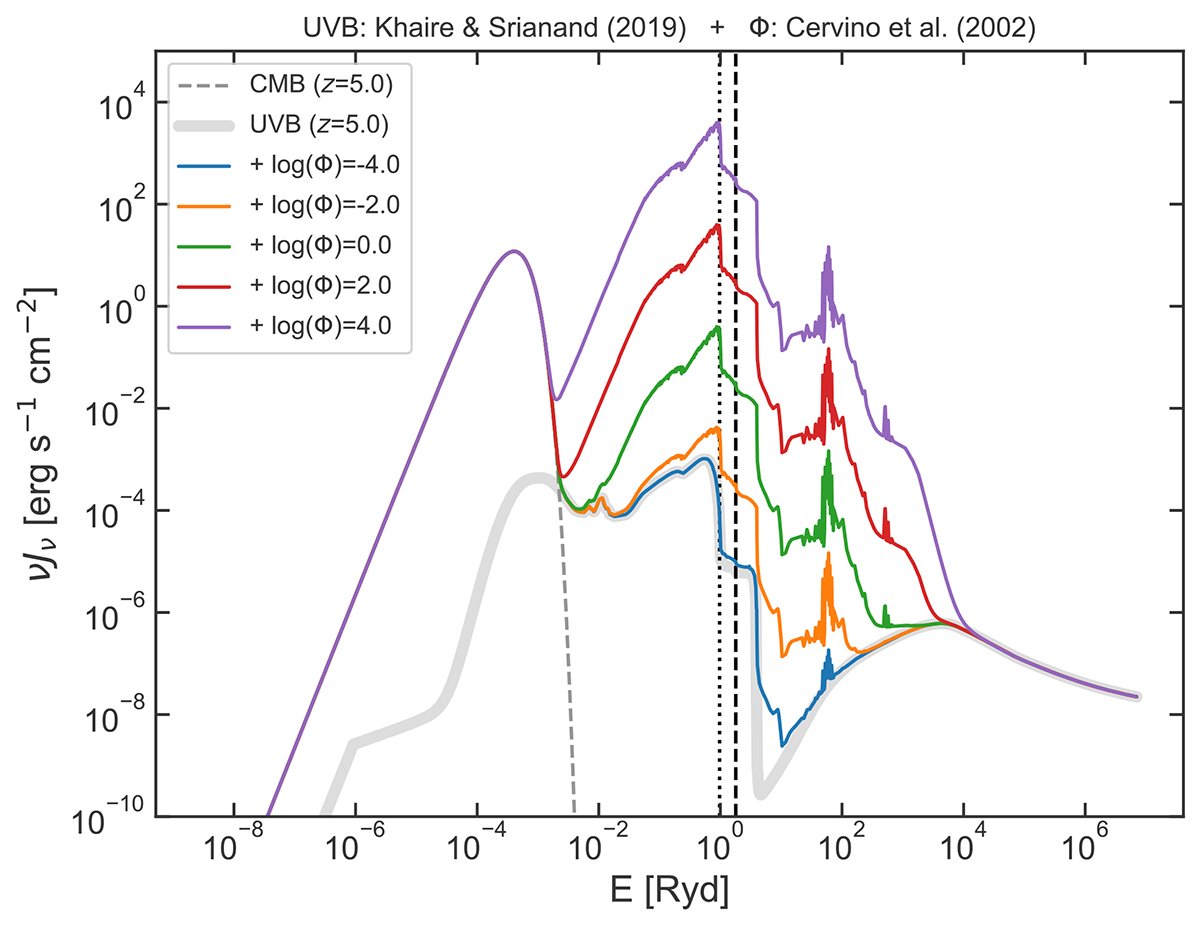
Fig. 3.
Download original image
Example of different input spectra used in the CLOUDY calculations. The solid light-gray line represents the UVB SED of Khaire & Srianand (2019), and the dashed gray line the CMB, both at z = 5. The vertical black lines represent the ionization energies of C→C+ (dotted) and C+→C++ (dashed). The colored lines represent the contribution to the SED due to young stars (Cerviño et al. 2002) at different normalizations, plus the contribution of the UVB. The units of the radiation field ϕ are M⊙ year−1 kpc−2.
Current usage metrics show cumulative count of Article Views (full-text article views including HTML views, PDF and ePub downloads, according to the available data) and Abstracts Views on Vision4Press platform.
Data correspond to usage on the plateform after 2015. The current usage metrics is available 48-96 hours after online publication and is updated daily on week days.
Initial download of the metrics may take a while.