Open Access
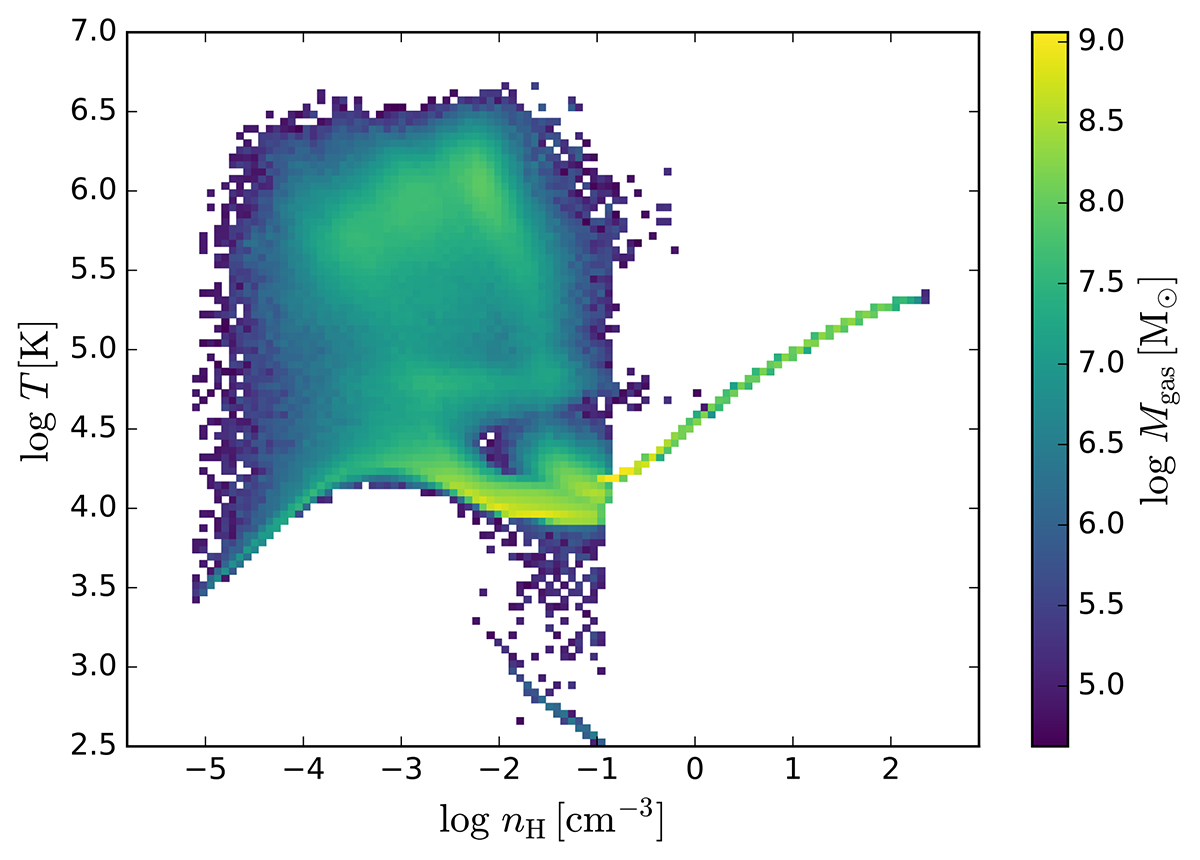
Fig. 2.
Download original image
Phase diagram for one of the selected TNG50 galaxies at z = 5, weighted and color-coded by the gas mass. The diagram encompasses all gas cells within R200. For densities above the star-formation threshold nH = 0.1, the temperatures are determined by the effective equation of state (Springel & Hernquist 2003).
Current usage metrics show cumulative count of Article Views (full-text article views including HTML views, PDF and ePub downloads, according to the available data) and Abstracts Views on Vision4Press platform.
Data correspond to usage on the plateform after 2015. The current usage metrics is available 48-96 hours after online publication and is updated daily on week days.
Initial download of the metrics may take a while.