Open Access
Fig. 16.
Download original image
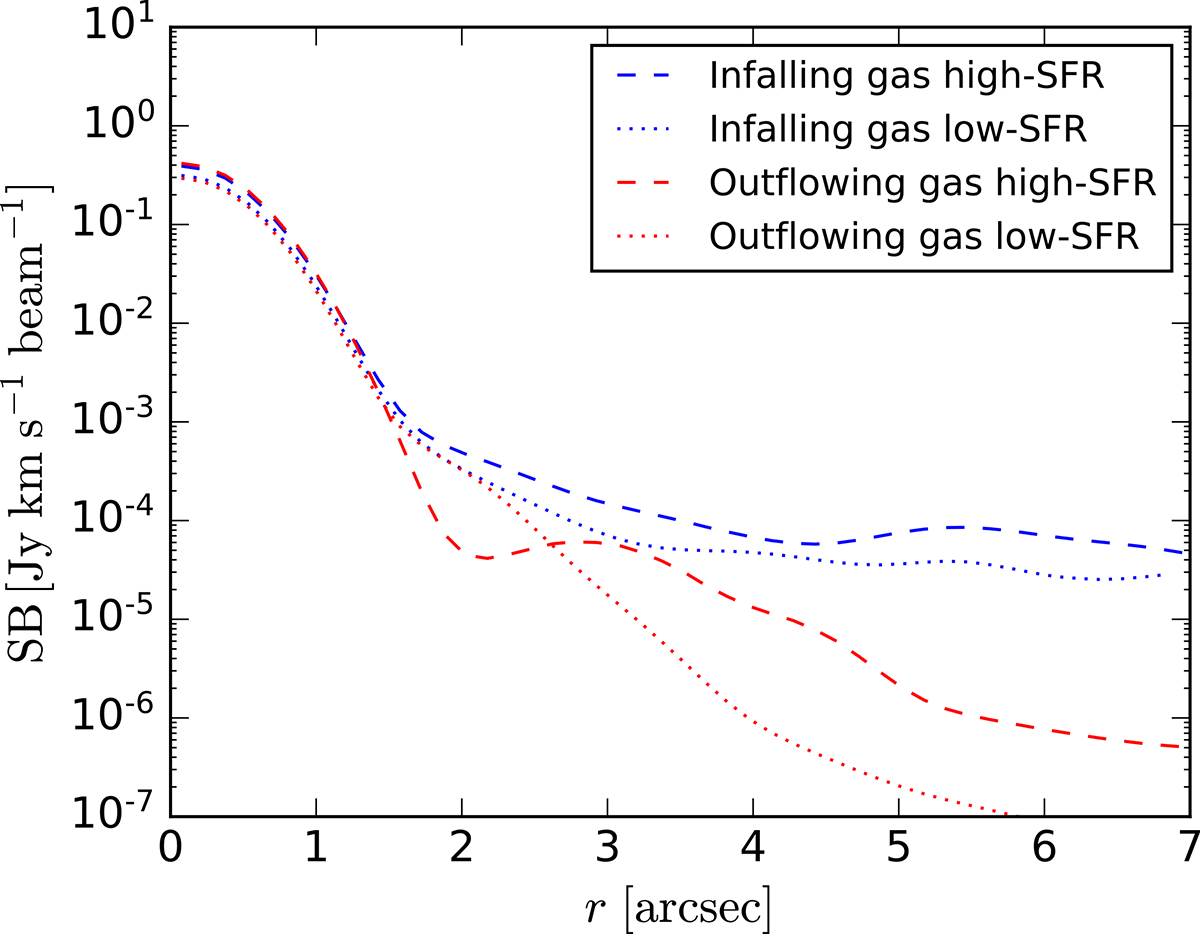
Averaged [CII] SB profiles for the outflowing (inflowing) gas only, represented by the red (blue) color. Our original TNG50 sample has been divided in two subsamples: high-SFR (dashed lines) and low-SFR (dotted lines). The C+ abundances have been estimated considering UVB and local young stars as ionization sources.
Current usage metrics show cumulative count of Article Views (full-text article views including HTML views, PDF and ePub downloads, according to the available data) and Abstracts Views on Vision4Press platform.
Data correspond to usage on the plateform after 2015. The current usage metrics is available 48-96 hours after online publication and is updated daily on week days.
Initial download of the metrics may take a while.