Fig. 4.
Download original image
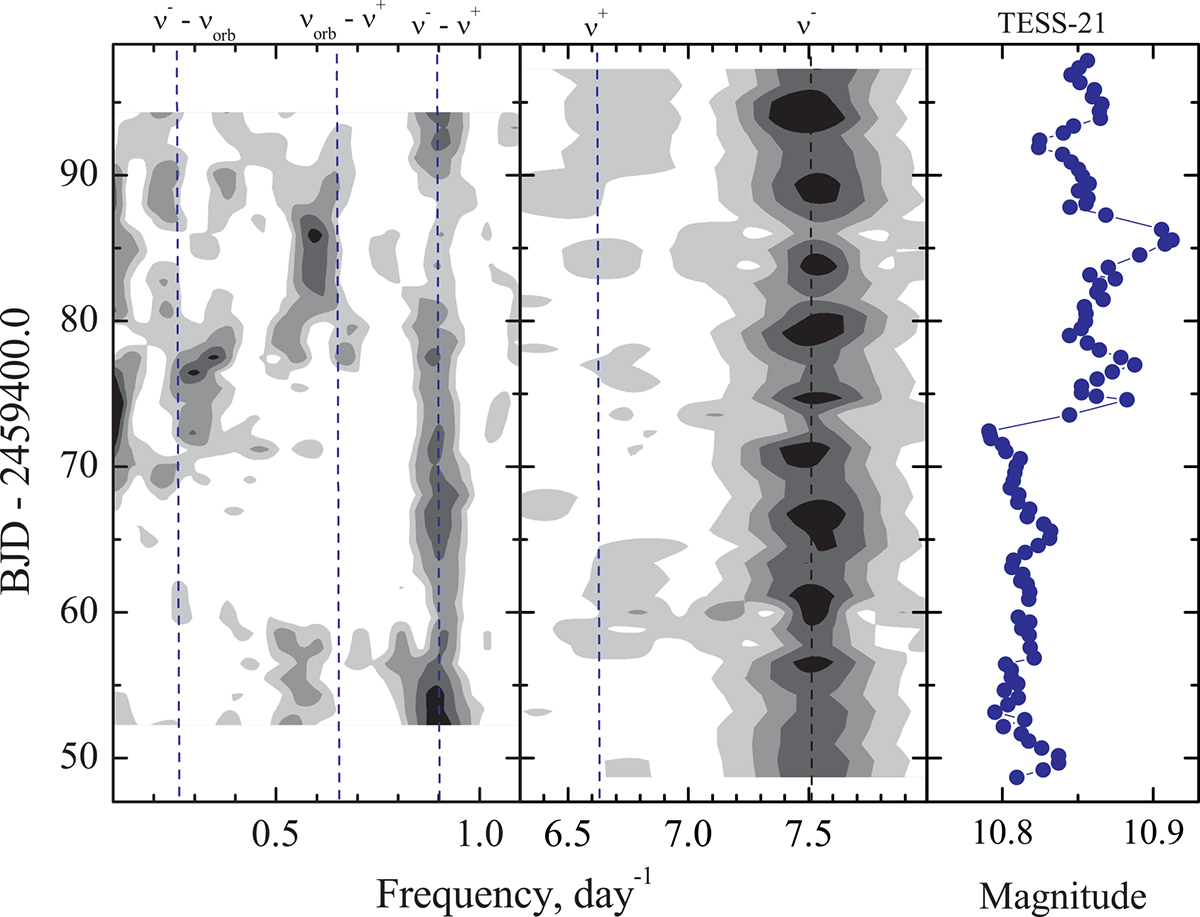
Sliding periodograms (slidograms) in two frequency ranges calculated for the TESS-21 data set, shown as gray-scale images. The slidograms in a low-frequency range of 0.1–1.1 d−1 are calculated with a window of 10 days, while for frequencies close to the orbital one, we used the window of 2 days. The right panel shows the light curve, also smoothed with the window of 2 days. Dashed vertical lines in the slidograms denote the important frequencies discussed in the paper (see text for explanation).
Current usage metrics show cumulative count of Article Views (full-text article views including HTML views, PDF and ePub downloads, according to the available data) and Abstracts Views on Vision4Press platform.
Data correspond to usage on the plateform after 2015. The current usage metrics is available 48-96 hours after online publication and is updated daily on week days.
Initial download of the metrics may take a while.