Fig. 3.
Download original image
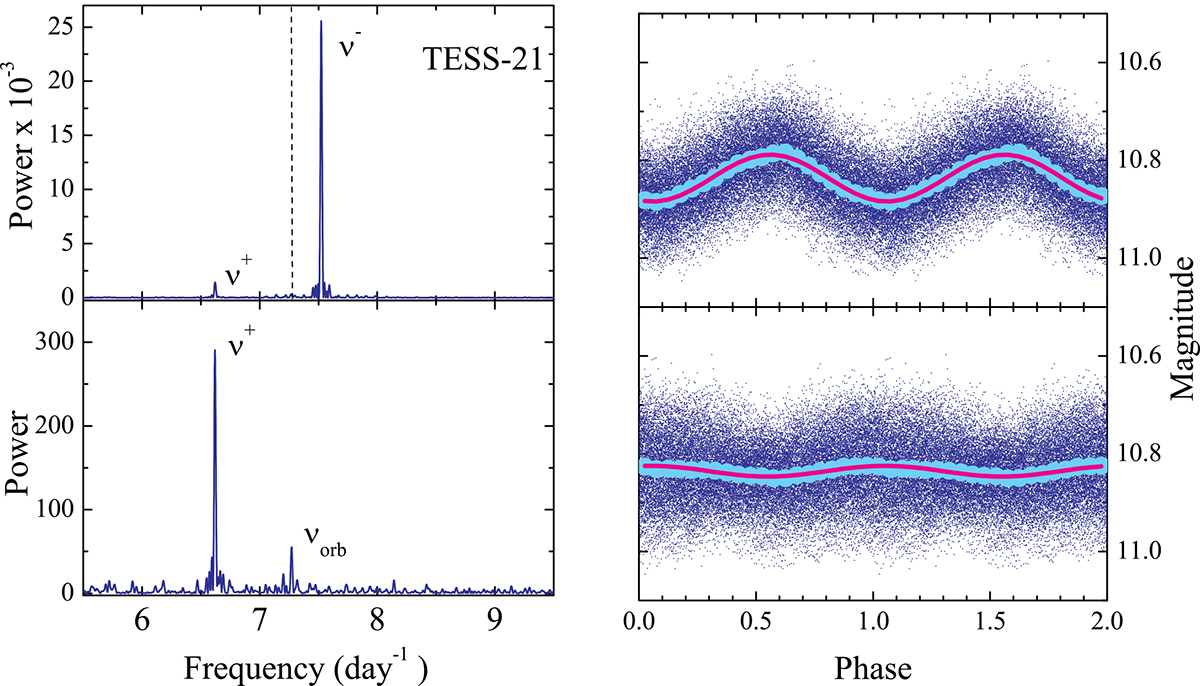
Results from a search for periods around the orbital one in TESS 21 light curves. Left panels: Periodograms of the observed (top panel) and pre-whitened by the ν− frequency (bottom panel) light curves of the TESS-21 observations in the frequency range of 5–10 d−1. The strongest peaks corresponding to the negative (ν−) and positive (ν+) superhumps and the orbital variability (νorb) are labeled. The position of the νorb frequency in the top panel is shown by the vertical dashed line. Right panels: The TESS-21 light curve folded with the negative (top panel) and positive (bottom panel) superhump periods. The phase-binned light curves and their best sinusoid fits are also shown.
Current usage metrics show cumulative count of Article Views (full-text article views including HTML views, PDF and ePub downloads, according to the available data) and Abstracts Views on Vision4Press platform.
Data correspond to usage on the plateform after 2015. The current usage metrics is available 48-96 hours after online publication and is updated daily on week days.
Initial download of the metrics may take a while.