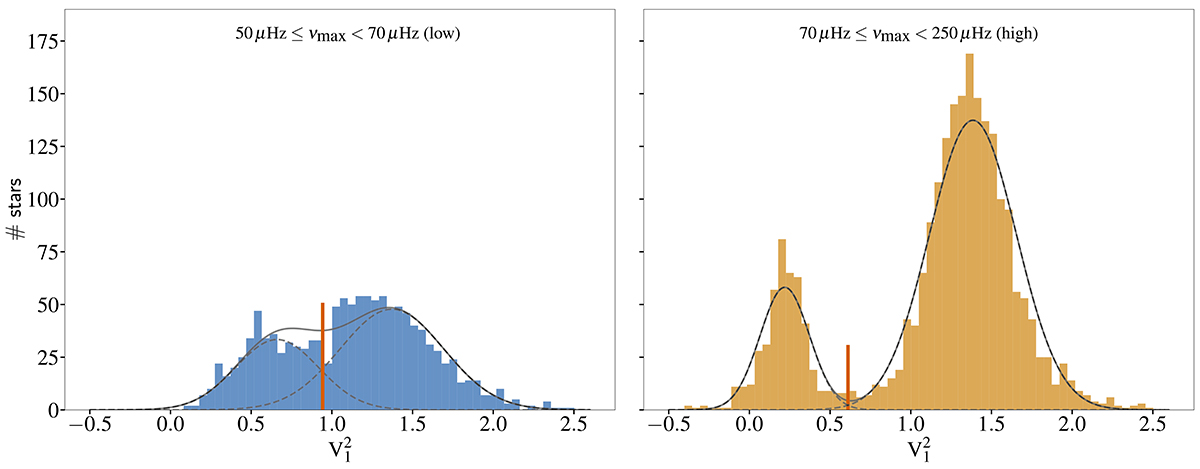
Fig. 2.
Download original image
Dipole-mode visibility distribution in the different νmax regimes for the RGB and CHeB stars analysed by Stello et al. (2016b). The thresholds for the visibility are highlighted with a vertical red line. In the low νmax regime, we selected a higher visibility threshold than that obtained from the intersection of the Gaussian components. The dipole-mode visibilities are taken from Stello et al. (2016b).
Current usage metrics show cumulative count of Article Views (full-text article views including HTML views, PDF and ePub downloads, according to the available data) and Abstracts Views on Vision4Press platform.
Data correspond to usage on the plateform after 2015. The current usage metrics is available 48-96 hours after online publication and is updated daily on week days.
Initial download of the metrics may take a while.