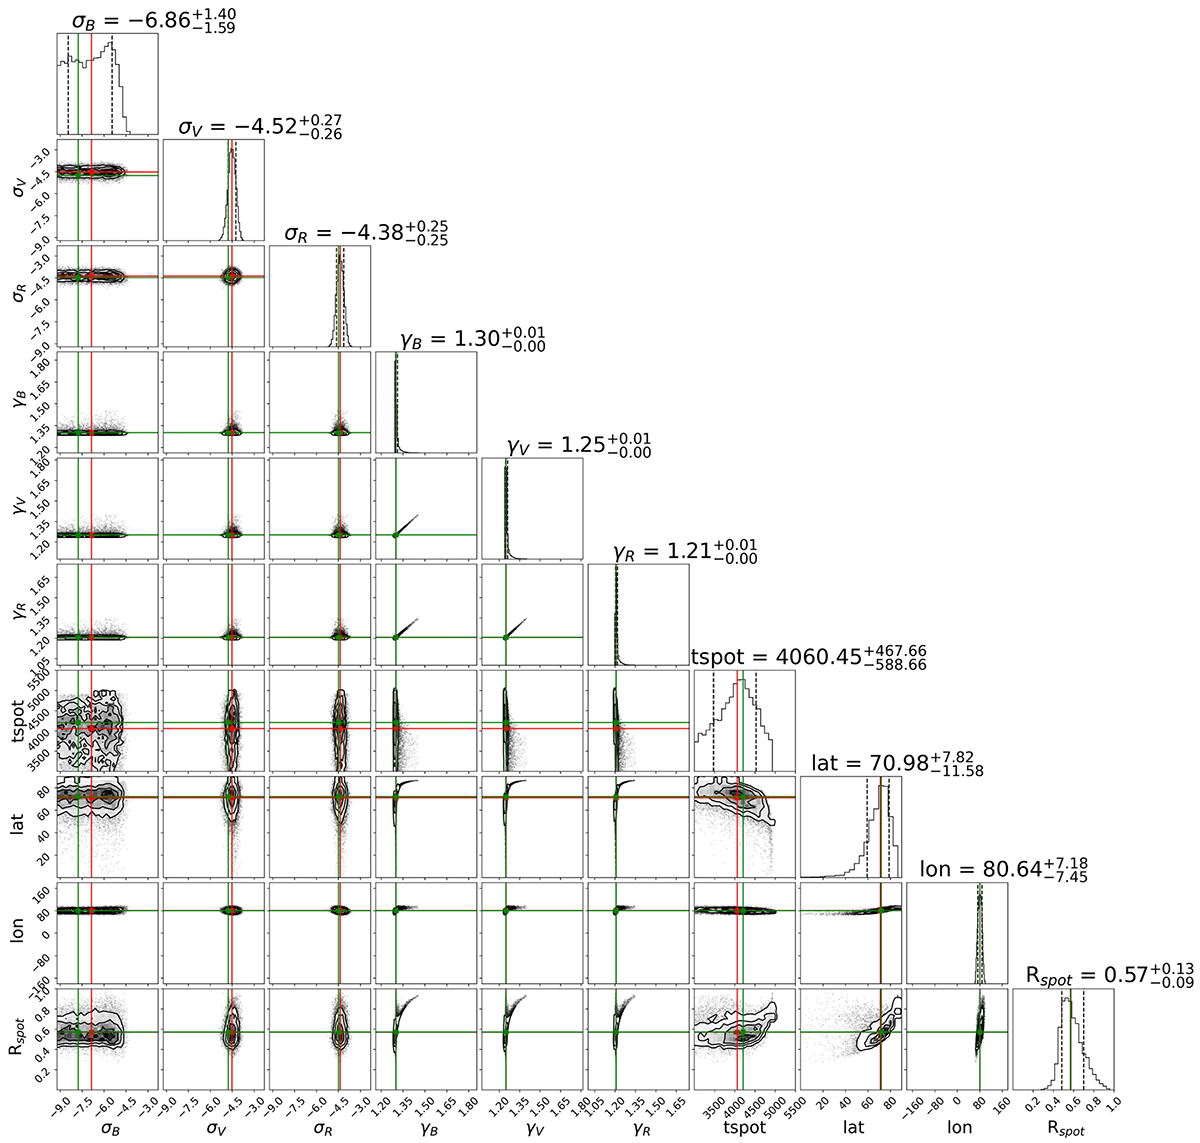
Fig. 3.
Download original image
Corner plot obtained by the retrieval procedure for the multi-band photometric data acquired by OPC in the first run of observation, specifically on February 23-24-25th, 2021. Next, σi represents the jitter parameters and γi the offsets of the forward model used in the retrieval for each band observed (B, V and R). Red lines mark median values, while green lines mark MAP values.
Current usage metrics show cumulative count of Article Views (full-text article views including HTML views, PDF and ePub downloads, according to the available data) and Abstracts Views on Vision4Press platform.
Data correspond to usage on the plateform after 2015. The current usage metrics is available 48-96 hours after online publication and is updated daily on week days.
Initial download of the metrics may take a while.