Fig. 2.
Download original image
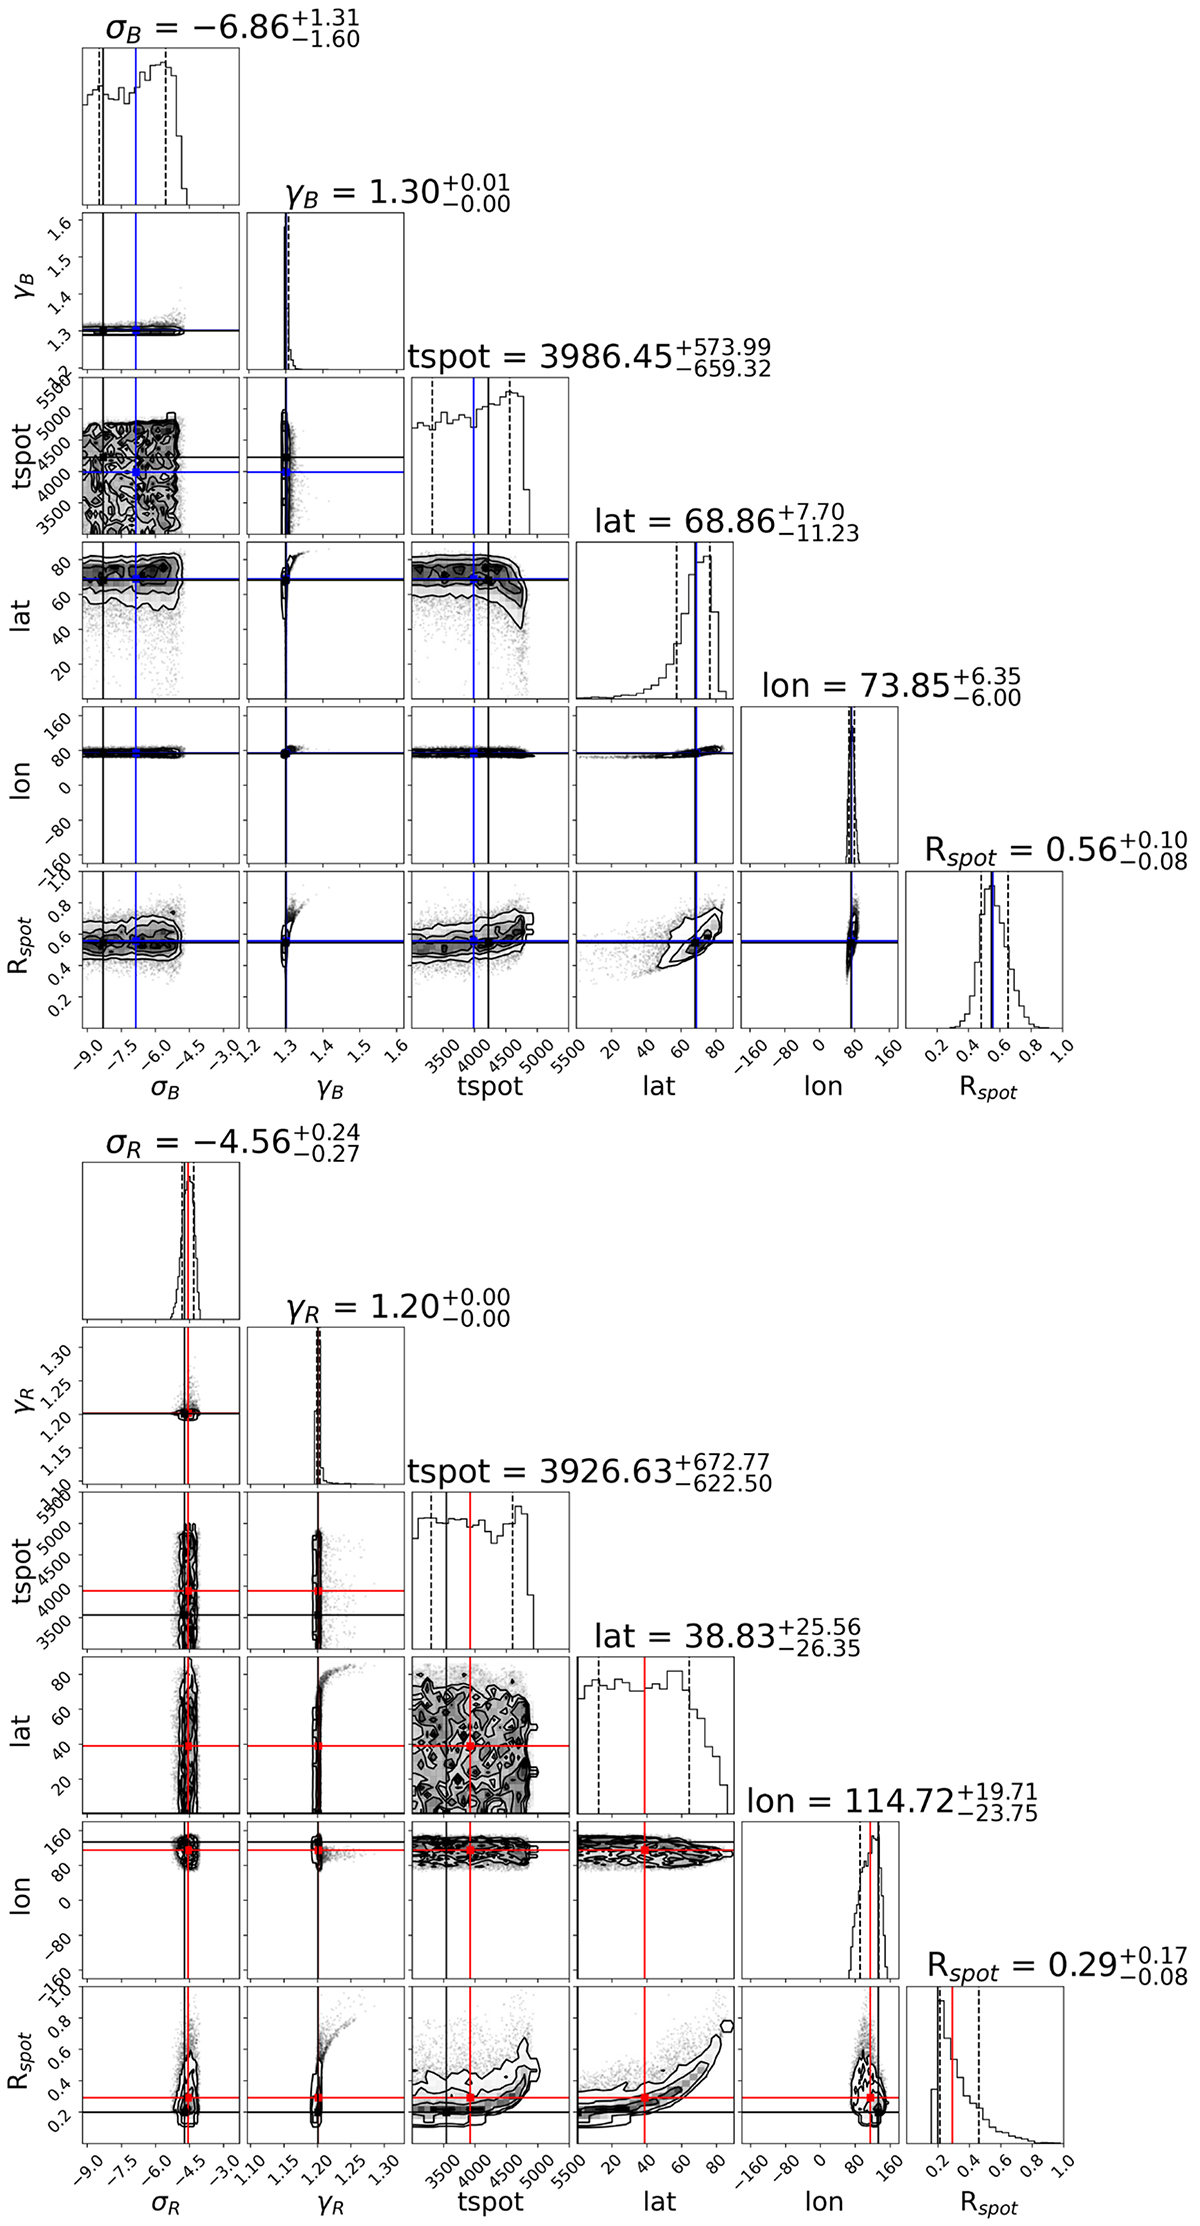
Comparison of the retrieval posteriors of spots for V1298 Tau, obtained by OPC observations on 23-24-25/02/2021 through a separate analysis for data in B (top) and R (bottom) photometric bands. Blue lines (for the right) and red lines (for the left) mark median values, while black lines mark maximum probability (MAP) values for both images.
Current usage metrics show cumulative count of Article Views (full-text article views including HTML views, PDF and ePub downloads, according to the available data) and Abstracts Views on Vision4Press platform.
Data correspond to usage on the plateform after 2015. The current usage metrics is available 48-96 hours after online publication and is updated daily on week days.
Initial download of the metrics may take a while.