Open Access
Fig. 11.
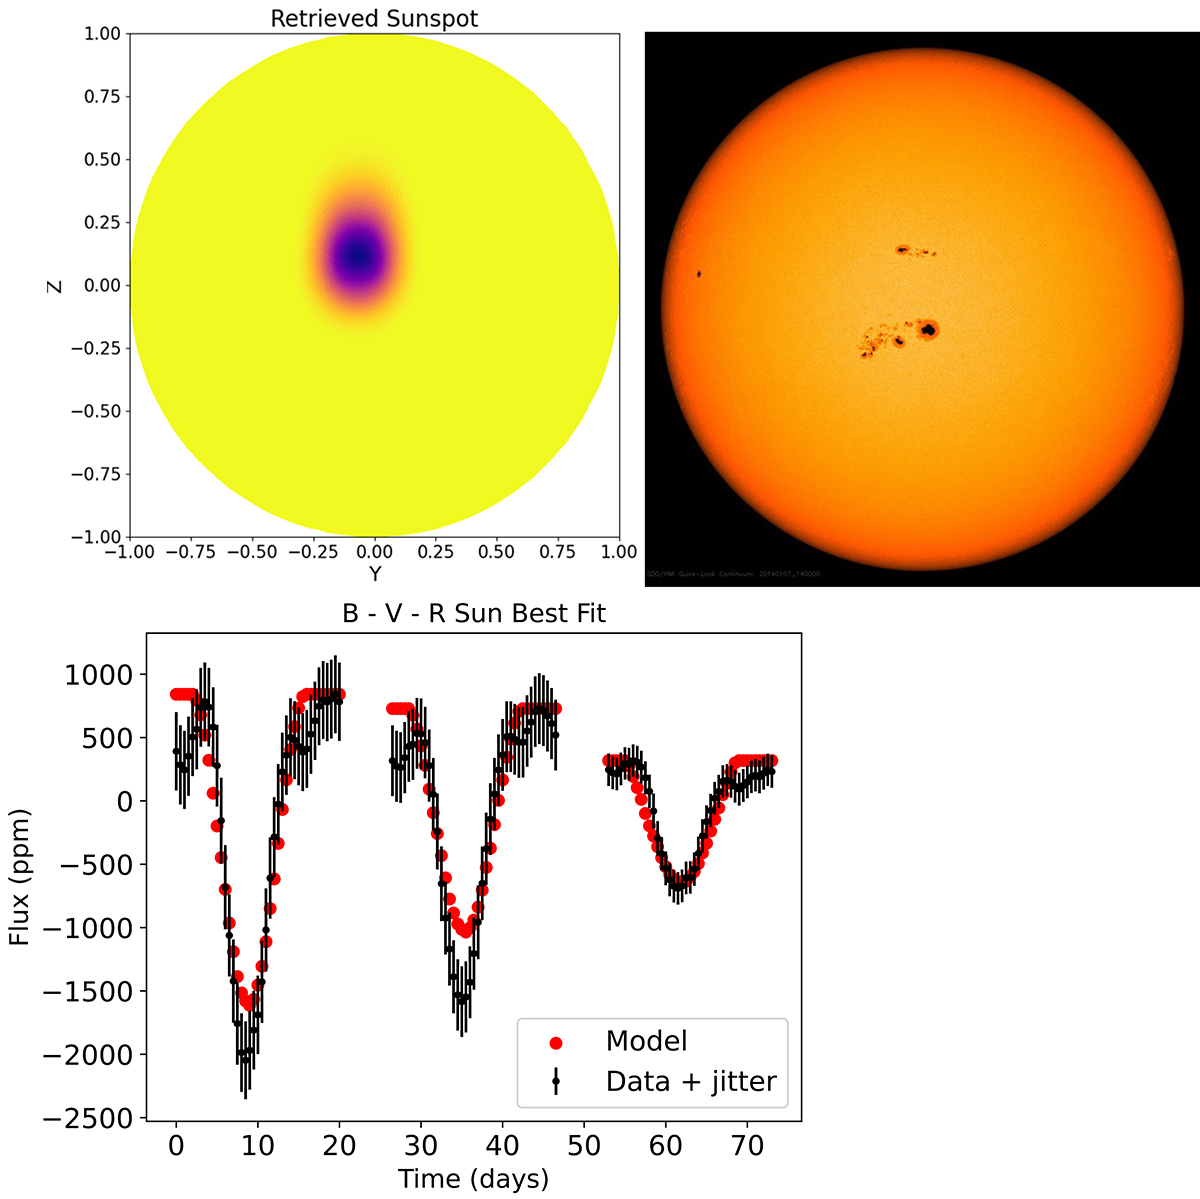
Download original image
Simulated sunspot according to our model results, shown in Fig. 10 (top). Real image of the Sun during the period studied, from HMI (top-left). Bottom panel shows the best fit of our model compared to the observed data for the Sun in all the three bands, from left to right: the B, V, and R filters, shifted in time.
Current usage metrics show cumulative count of Article Views (full-text article views including HTML views, PDF and ePub downloads, according to the available data) and Abstracts Views on Vision4Press platform.
Data correspond to usage on the plateform after 2015. The current usage metrics is available 48-96 hours after online publication and is updated daily on week days.
Initial download of the metrics may take a while.