Fig. 1.
Download original image
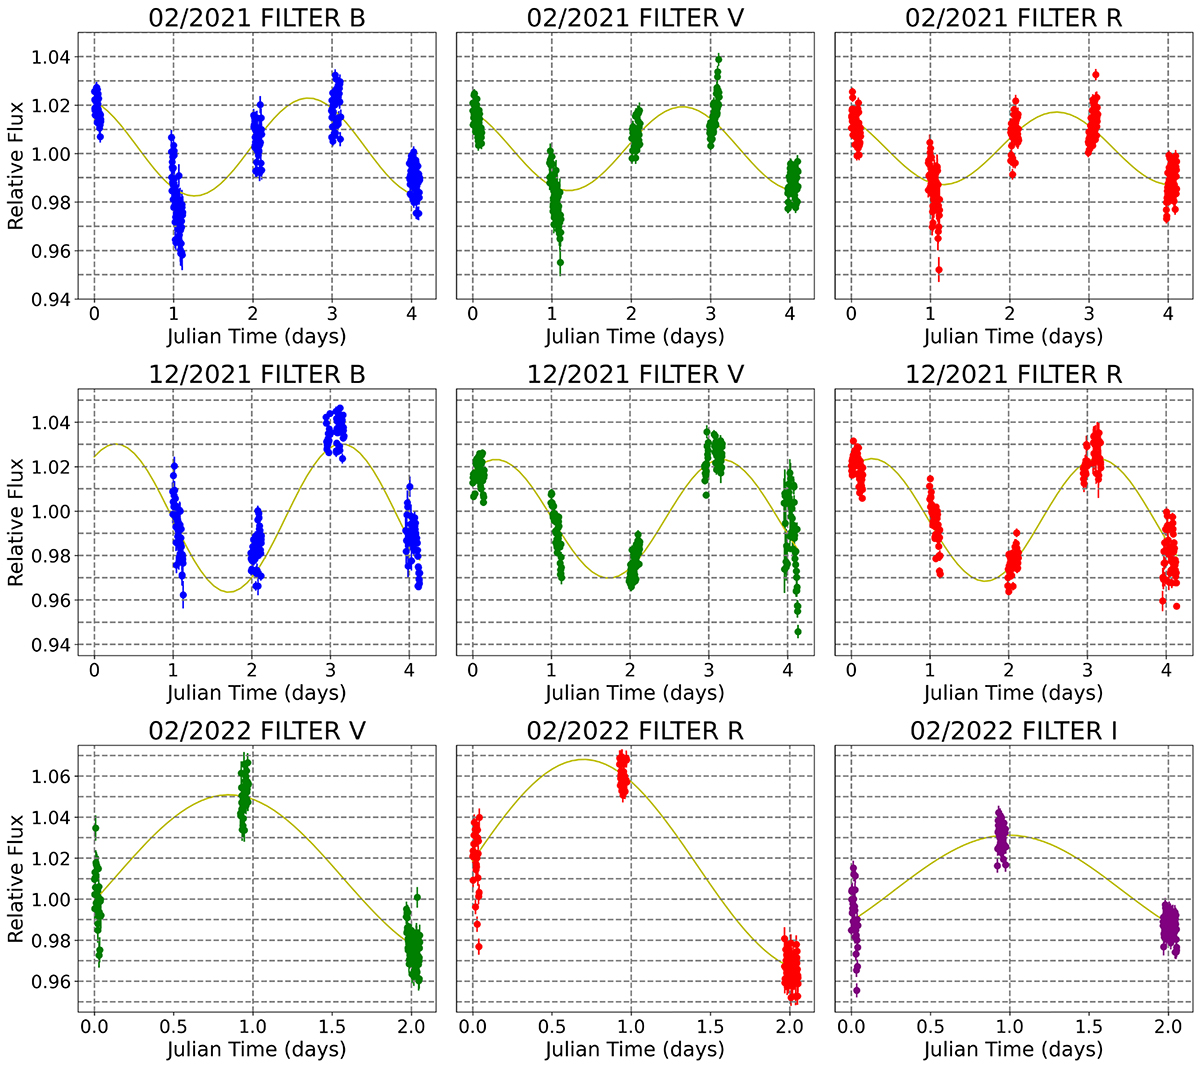
Data observed from OPC in the B, V, and R bands in February 2021 and December 2021 and in V, R, and I bands in February 2022. The plotted line is an estimation of the flux variation of the star obtained by fitting the data by using a sinusoidal function with an offset. For the observations of February 2022 and for the first day of observation of December 2021, B band data were discarded given their signal-to-noise ratio (S/N) of < 20.
Current usage metrics show cumulative count of Article Views (full-text article views including HTML views, PDF and ePub downloads, according to the available data) and Abstracts Views on Vision4Press platform.
Data correspond to usage on the plateform after 2015. The current usage metrics is available 48-96 hours after online publication and is updated daily on week days.
Initial download of the metrics may take a while.