Fig. 6.

Download original image
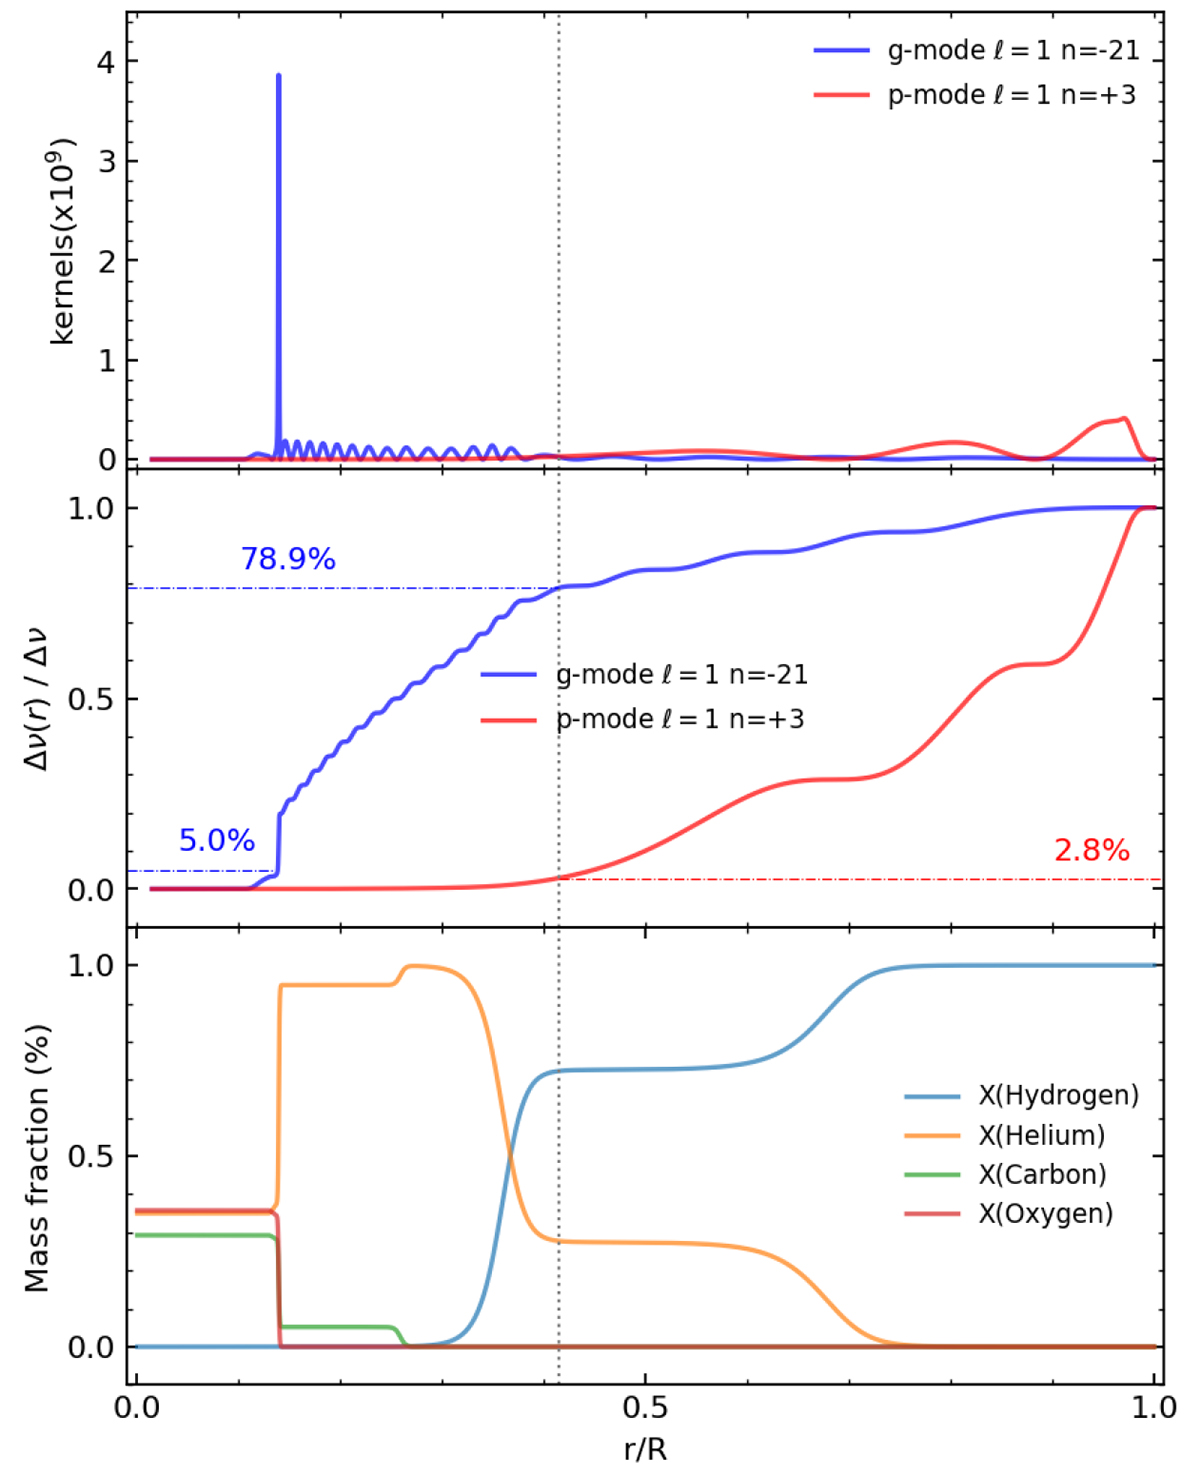
Typical static sdB stellar model. Top panel: Rotation kernel as a function of the normalised radius for a typical g-mode (blue line; ℓ = 1, n = −21) and a typical p-mode (red line; ℓ = 1, n = 3) in our representative model of TIC 441725813. Middle panel: Running integral of Eq. (1) normalised to one showing which stellar regions contribute most to the frequency splitting for each mode. Bottom panel: Chemical stratification in our adopted representative model showing the run of the hydrogen, helium, carbon, and oxygen mass fractions. The vertical line present in all panels indicates the boundary between the hydrogen-rich envelope and the helium mantle.
Current usage metrics show cumulative count of Article Views (full-text article views including HTML views, PDF and ePub downloads, according to the available data) and Abstracts Views on Vision4Press platform.
Data correspond to usage on the plateform after 2015. The current usage metrics is available 48-96 hours after online publication and is updated daily on week days.
Initial download of the metrics may take a while.


