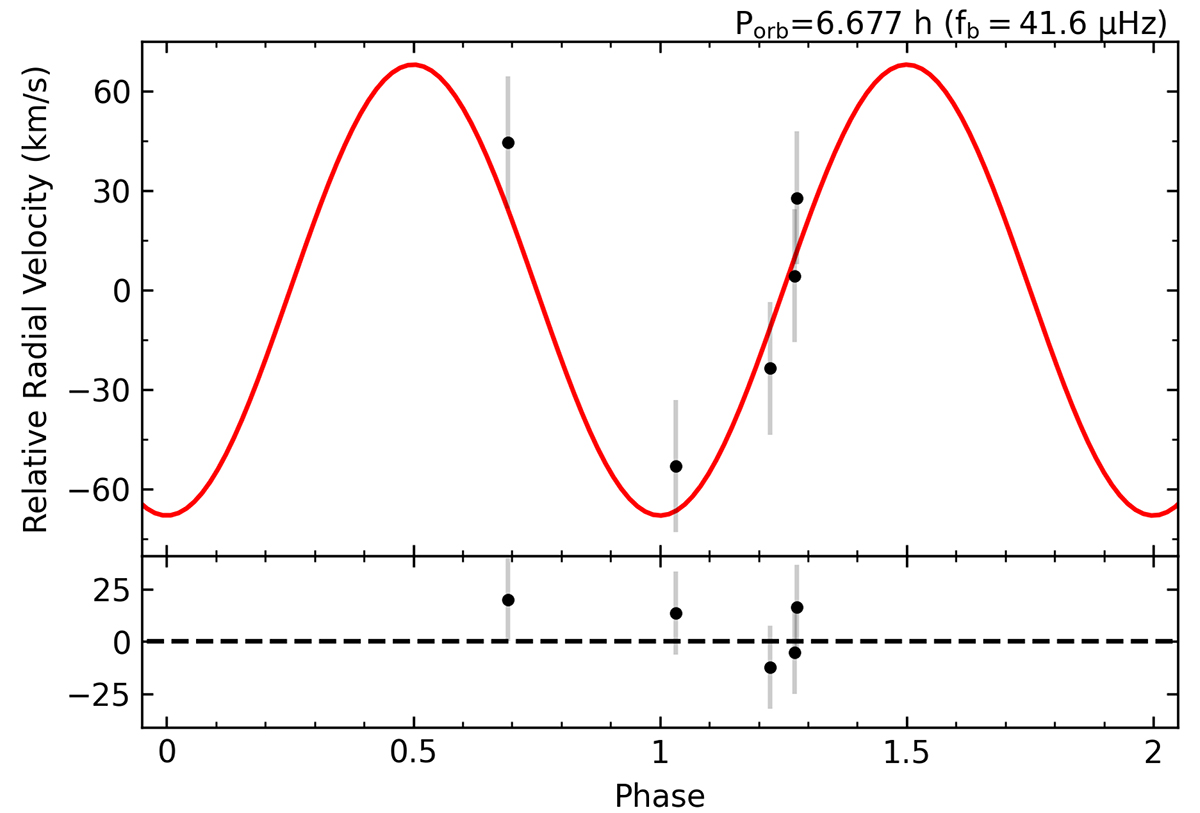
Fig. 5.
Download original image
Phase – radial velocity diagram. Upper panel: The red line represents the radial velocity curve assumed for the orbital signal at 41.6 μHz (6.677 h). The black dots represent the relative radial velocities obtained from spectroscopic observations, with grey vertical lines indicating estimated errors. Lower panel: The residual plot of the fitting results is shown.
Current usage metrics show cumulative count of Article Views (full-text article views including HTML views, PDF and ePub downloads, according to the available data) and Abstracts Views on Vision4Press platform.
Data correspond to usage on the plateform after 2015. The current usage metrics is available 48-96 hours after online publication and is updated daily on week days.
Initial download of the metrics may take a while.