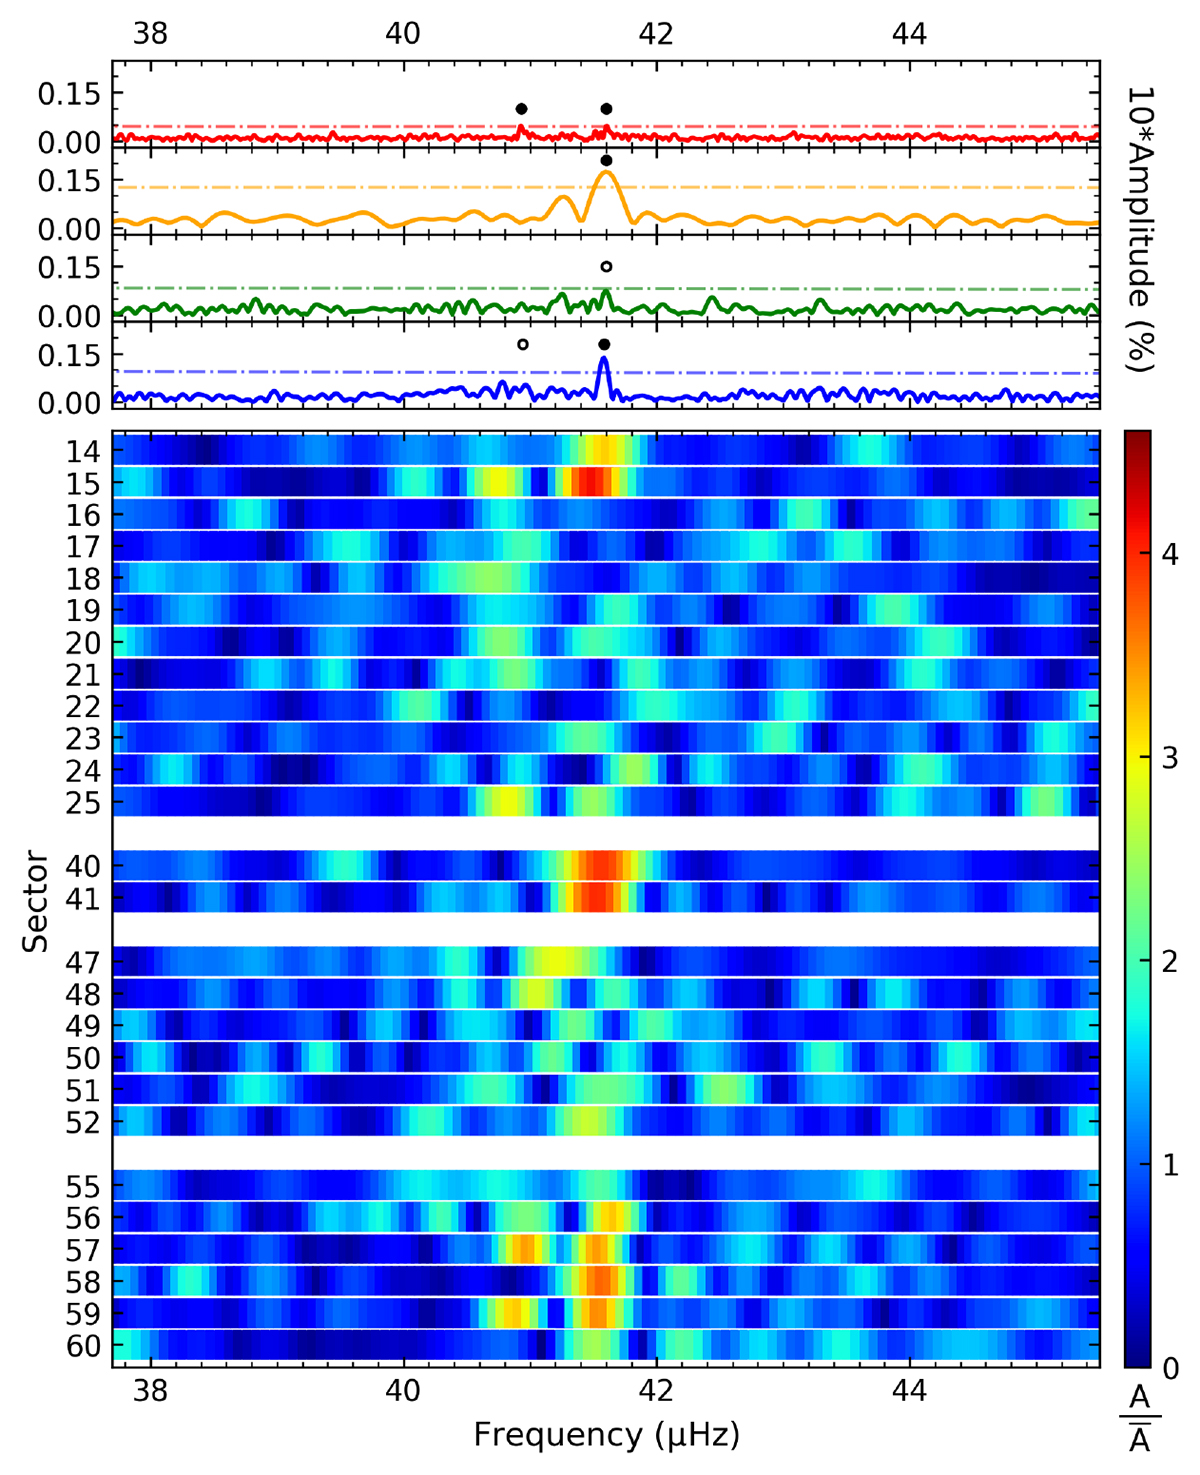
Fig. 4.
Download original image
Close-up view of the LSPs in the low-frequency range. The upper panels show the LSPs of the four data sets in that region. The red horizontal line indicates our adopted detection threshold of 5.2 times the local median noise level. The black dots mark the position of signals with S/N larger than 5.2. Black circles are possible signals just below the threshold. The lower panels show time-frequency maps built from the LSPs of each sector in the same frequency range. Amplitudes are colour-encoded according to the scale shown in the colour bar on the right-hand side.
Current usage metrics show cumulative count of Article Views (full-text article views including HTML views, PDF and ePub downloads, according to the available data) and Abstracts Views on Vision4Press platform.
Data correspond to usage on the plateform after 2015. The current usage metrics is available 48-96 hours after online publication and is updated daily on week days.
Initial download of the metrics may take a while.