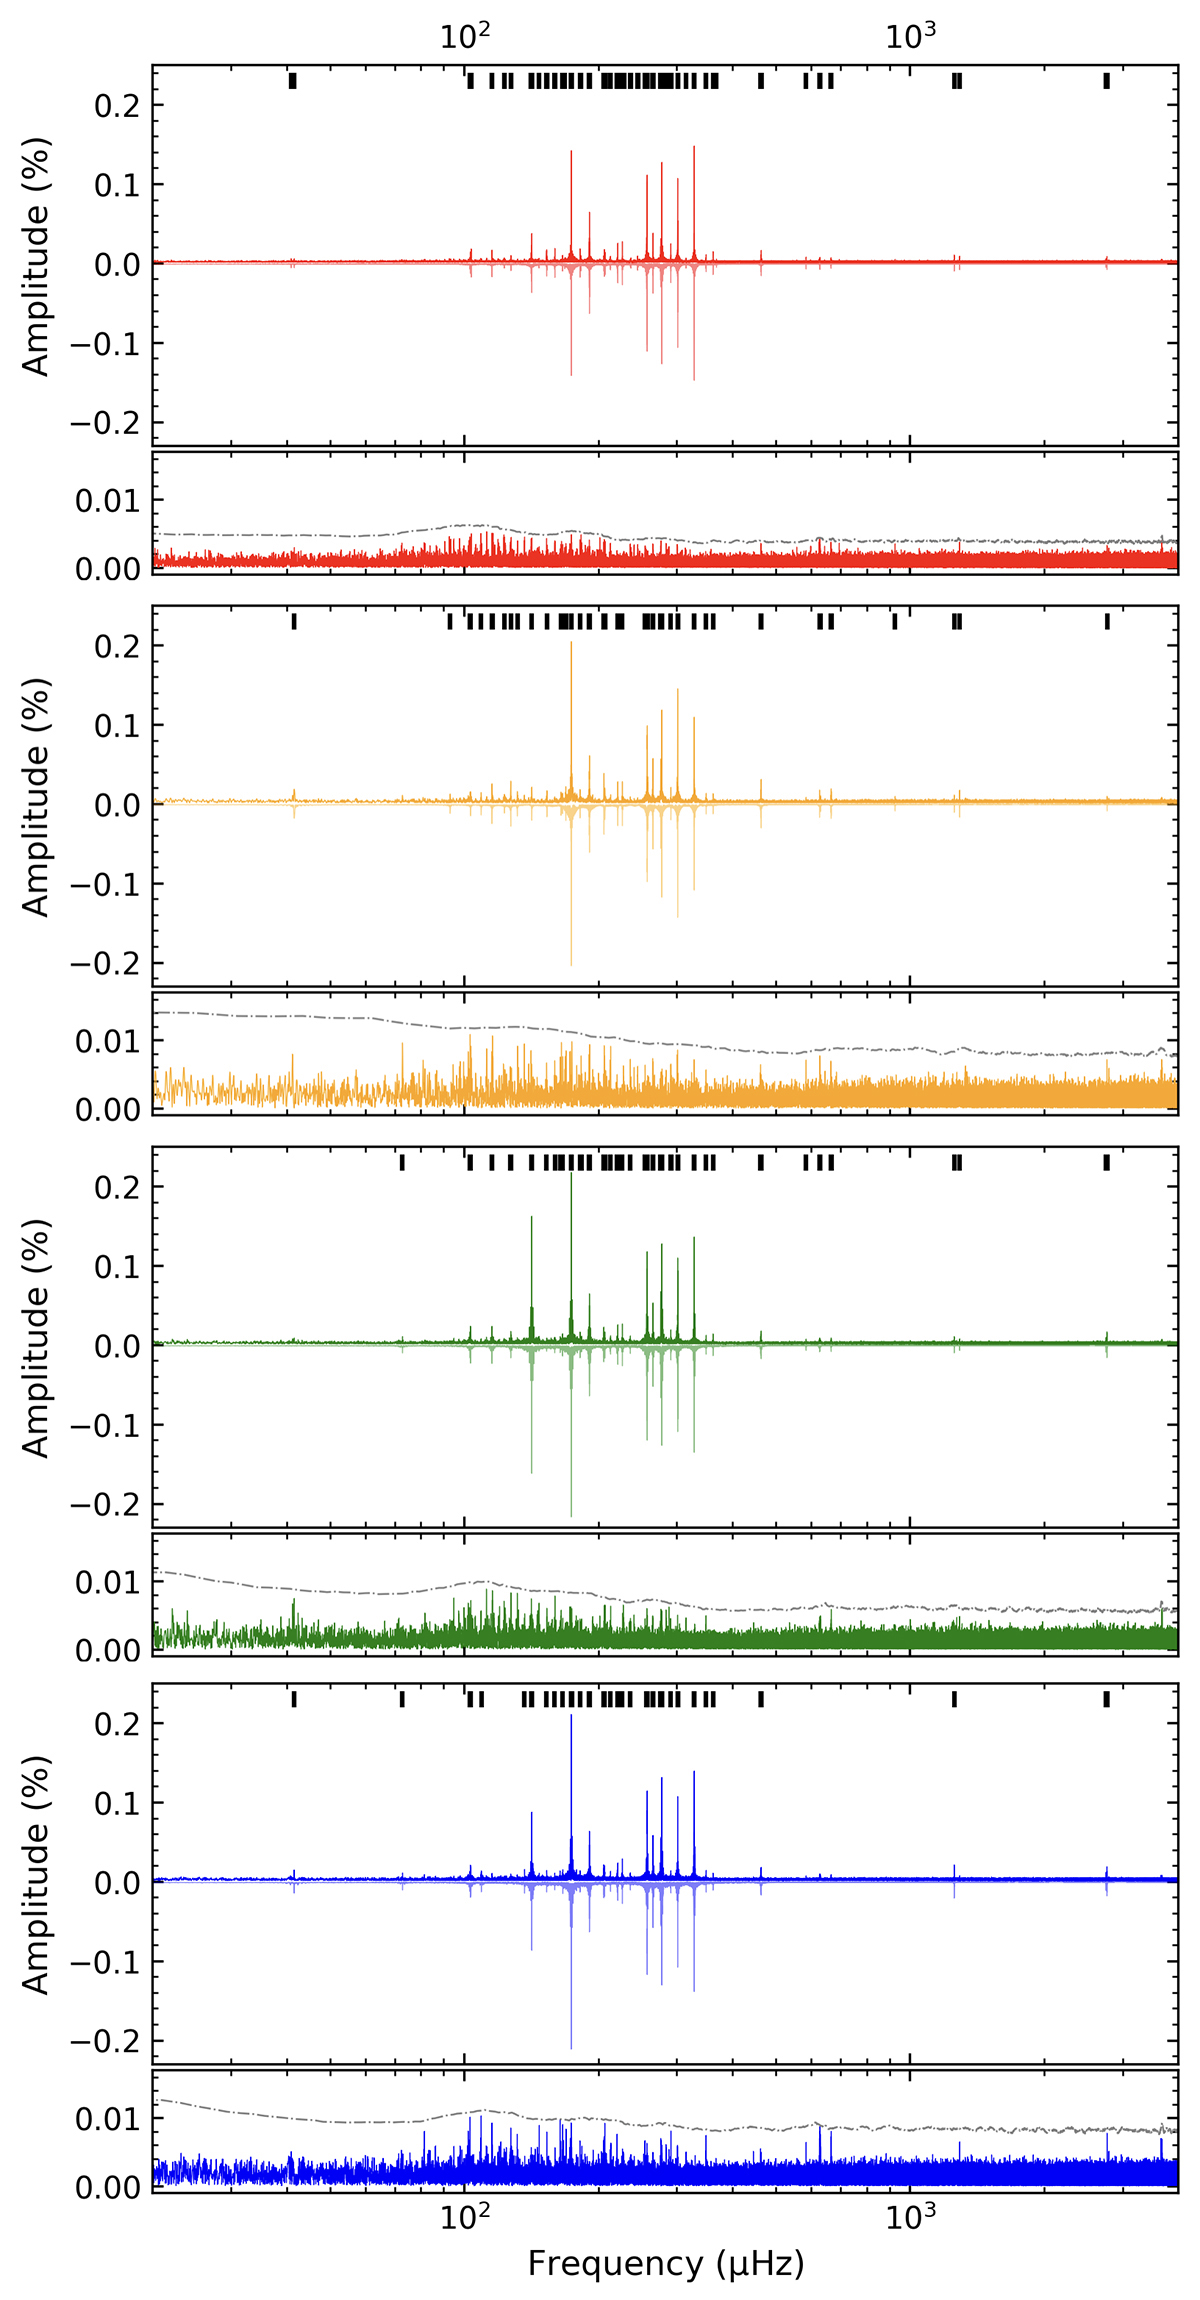
Fig. 3.
Download original image
Lomb-Scargle periodograms (LSPs; amplitude in per cent of the mean brightness versus frequency in μHz) for each data set constructed from the TESS observation of TIC 441725813 (from top to bottom, respectively). The grey horizontal line indicates our conservative threshold of 5.2 times the median noise level (see text). The upper panel in each diagram displays all signals extracted above 5.2 times S/N. The curve plotted upside-down is the reconstruction of the LSPs based on all extracted frequencies. The lower panels show the residual left after extracting all the significant frequencies.
Current usage metrics show cumulative count of Article Views (full-text article views including HTML views, PDF and ePub downloads, according to the available data) and Abstracts Views on Vision4Press platform.
Data correspond to usage on the plateform after 2015. The current usage metrics is available 48-96 hours after online publication and is updated daily on week days.
Initial download of the metrics may take a while.