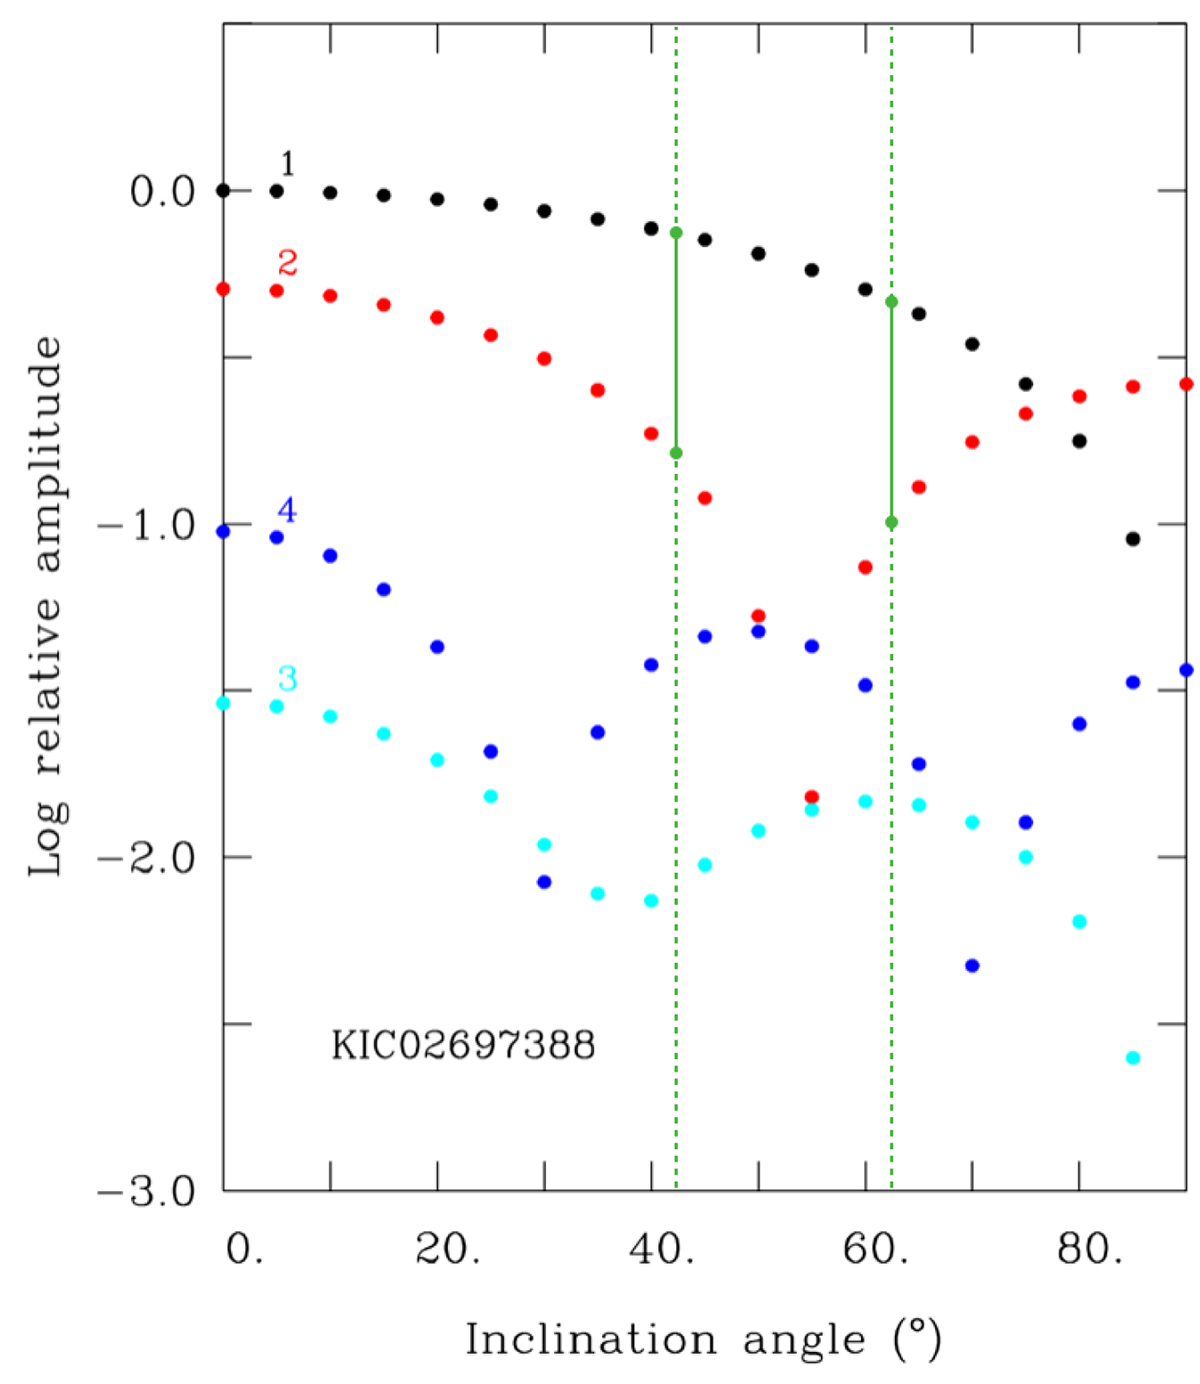
Fig. 14.
Download original image
Relative amplitude (in logarithmic scale) for g-mode oscillations as a function of the inclination angle and degree ℓ (assuming m = 0). Degrees ℓ = 1 (black), 2 (red), 3 (cyan), and 4 (blue) are represented. These visibility functions were evaluated by Charpinet et al. (2011b) for an sdB model with parameters representative of KIC 2697388 observed in the Kepler band-pass. For simplicity, we adopt the same model for TIC 441725813. The Green lines indicate the constraints we obtain for that star.
Current usage metrics show cumulative count of Article Views (full-text article views including HTML views, PDF and ePub downloads, according to the available data) and Abstracts Views on Vision4Press platform.
Data correspond to usage on the plateform after 2015. The current usage metrics is available 48-96 hours after online publication and is updated daily on week days.
Initial download of the metrics may take a while.