Open Access
Fig. 13.
Download original image
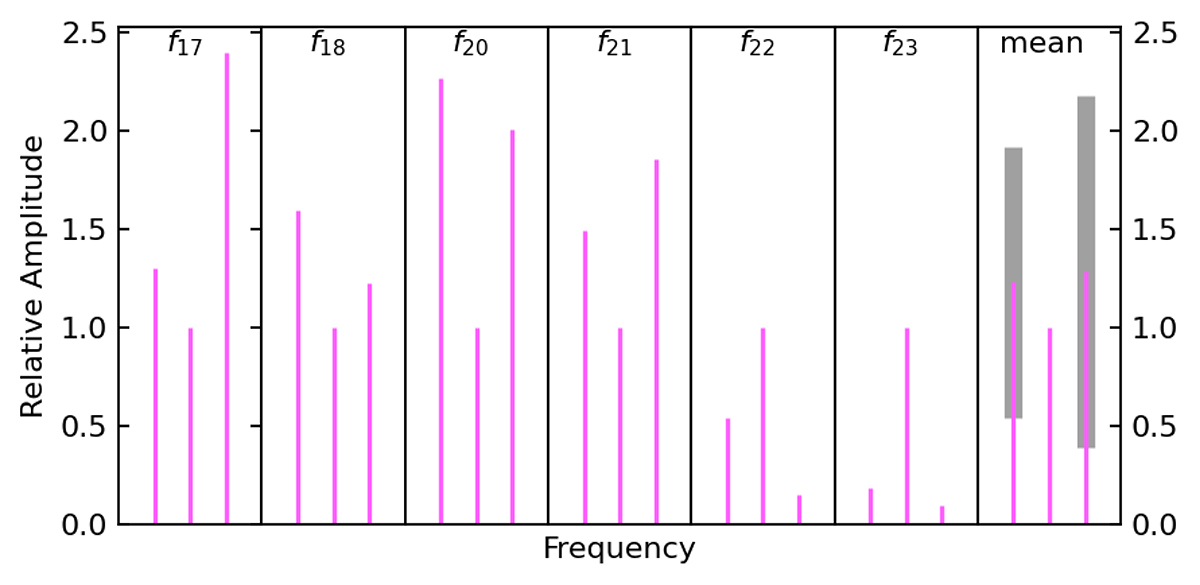
Relative amplitudes within six ℓ = 1 triplets detected in the first data set. The amplitude of the central component is normalised to one before computing average amplitudes, which are shown in the right-most panel. The error bars (in grey) are the standard deviations around the mean amplitudes.
Current usage metrics show cumulative count of Article Views (full-text article views including HTML views, PDF and ePub downloads, according to the available data) and Abstracts Views on Vision4Press platform.
Data correspond to usage on the plateform after 2015. The current usage metrics is available 48-96 hours after online publication and is updated daily on week days.
Initial download of the metrics may take a while.