Fig. 12.
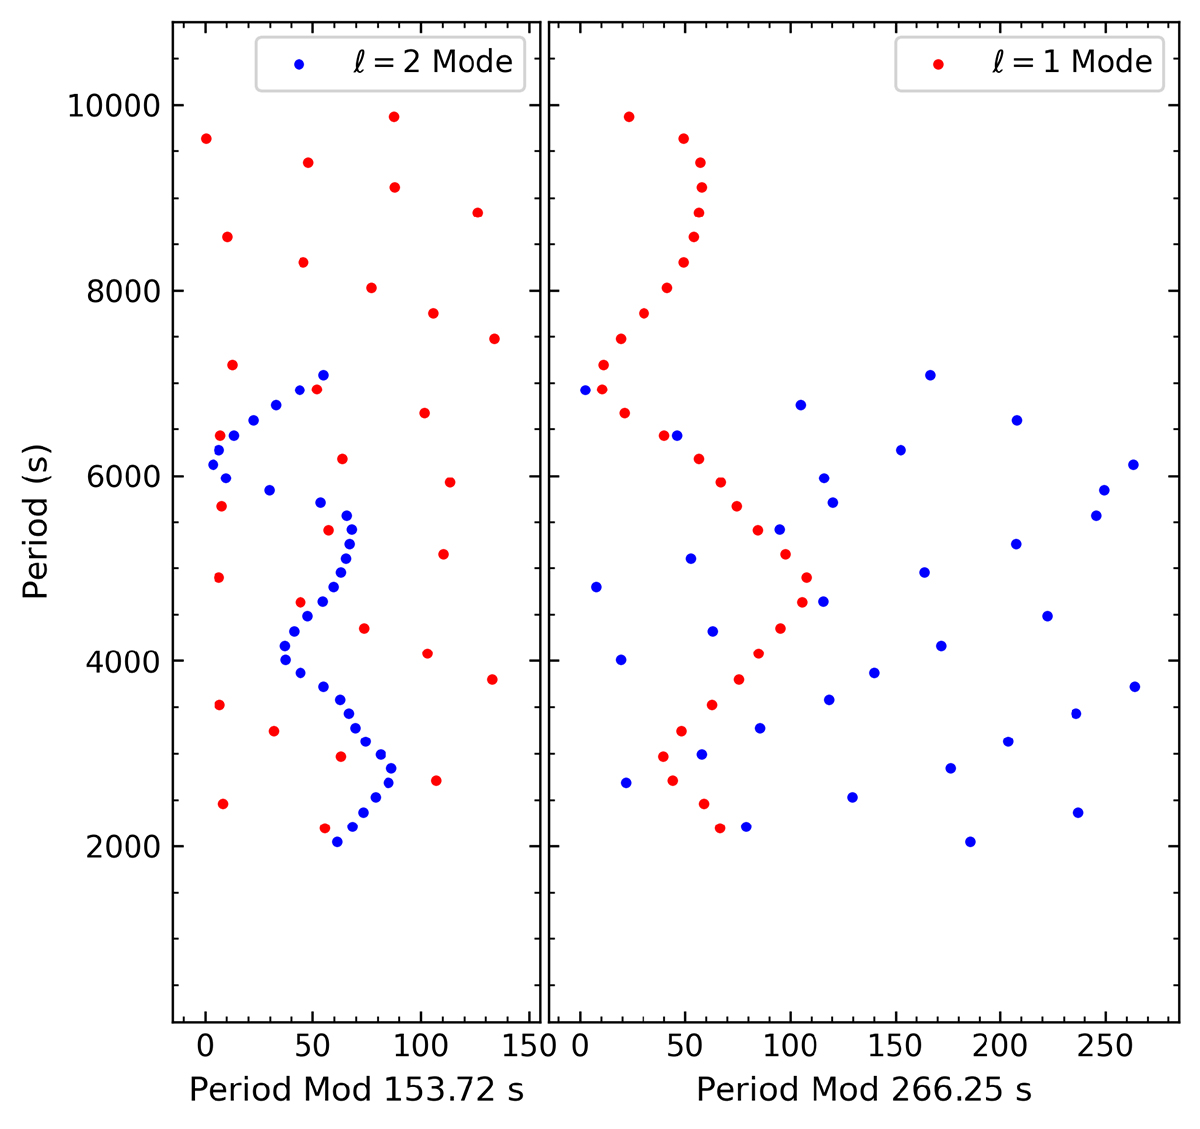
Download original image
Theoretical frequency distribution in echelle diagrams for a representative sdB model. The right-hand side panel shows the echelle diagram for the computed ℓ = 1 modes (red dots) with a period spacing ΔΠℓ = 1 = 266.25 s. The left-hand side panel is the echelle diagram for the computed ℓ = 2 series (blue dots) with ΔΠℓ = 2 = 153.72 s. Deviation from strict asymptotic period relations is caused by structural features inside the sdB star and qualitatively shows similar patterns as observed in Fig. 11.
Current usage metrics show cumulative count of Article Views (full-text article views including HTML views, PDF and ePub downloads, according to the available data) and Abstracts Views on Vision4Press platform.
Data correspond to usage on the plateform after 2015. The current usage metrics is available 48-96 hours after online publication and is updated daily on week days.
Initial download of the metrics may take a while.