Fig. 3
Download original image
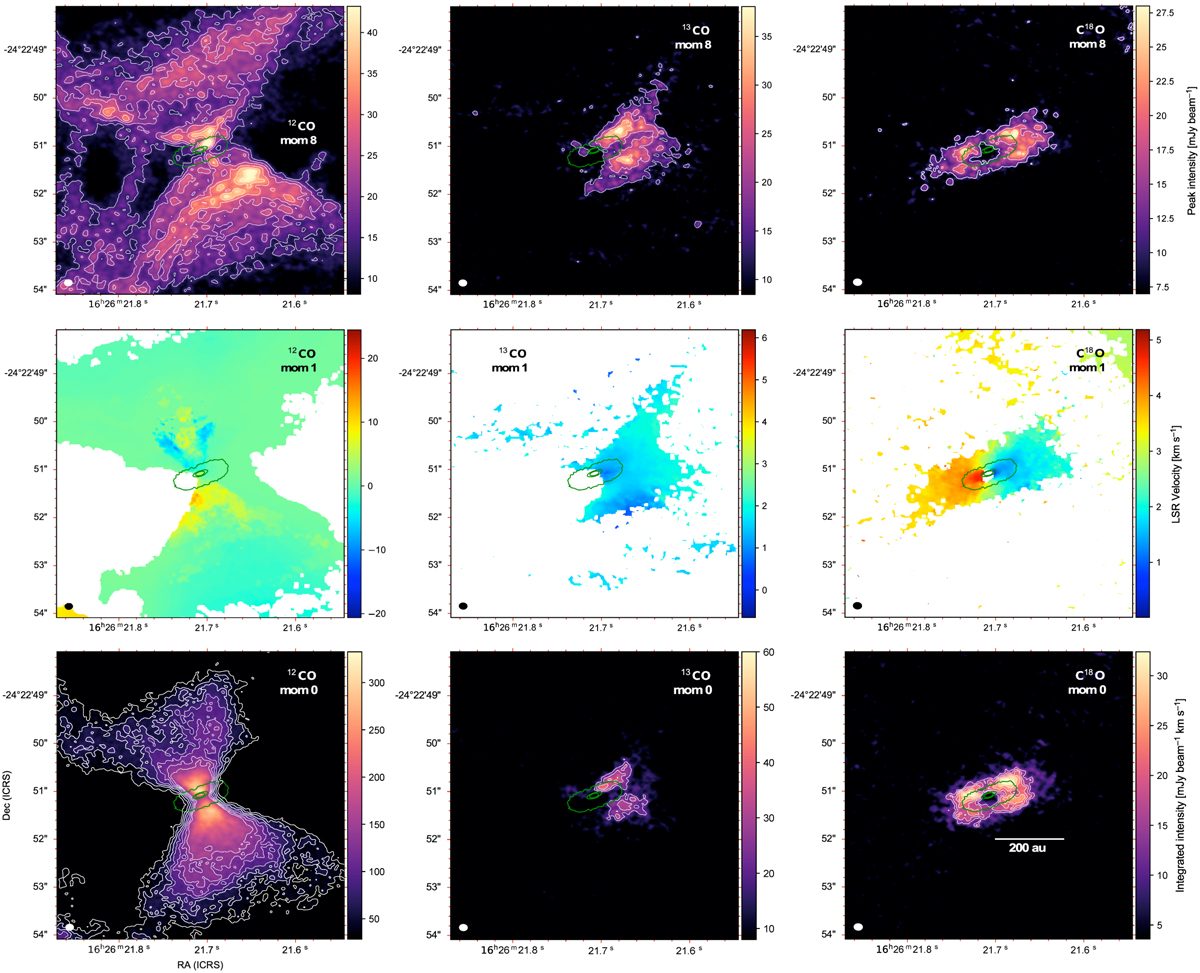
Moment maps of the detected CO isotopologs. The left column shows 12CO (2–1) , the middle column shows 13CO (2–1) , and the right column shows C18O (2–1). The top row shows the peak intensity map, the center row shows the intensity-weighted velocity map, and the bottom row shows the integrated intensity map. The synthesized beam is represented as a filled ellipse at the bottom left side of every panel. The green contours represent the disk continuum emission with 10, 150, and 200 times the rms. The white contours represent 3, 5, 7, 9, 11, 13, and 15 times the rms (1σ = 9.5 mJy beam-1 km s–1) for the 12CO (2–1) moment 0 map; 5, 7, 9, 11, 13, and 15 times the rms (1σ = 2.7 mJy beam-1) for 12CO (2–1) moment 8; 3, 5, 7, 9, and 11 times the rms for 13CO (2–1) moment 0 (1σ = 4.0 mJy beam–1 km s–1) and 8 (1σ = 4.2 mJy beam–1); and 3, 5, 7, 9, 11, 13, 15, and 17 times the rms for C18O (2–1) moment 0 (1σ = 3.5 mJy beam–1 km s–1) and 8 (1σ = 1.8 mJy beam–1).
Current usage metrics show cumulative count of Article Views (full-text article views including HTML views, PDF and ePub downloads, according to the available data) and Abstracts Views on Vision4Press platform.
Data correspond to usage on the plateform after 2015. The current usage metrics is available 48-96 hours after online publication and is updated daily on week days.
Initial download of the metrics may take a while.