Fig. 2
Download original image
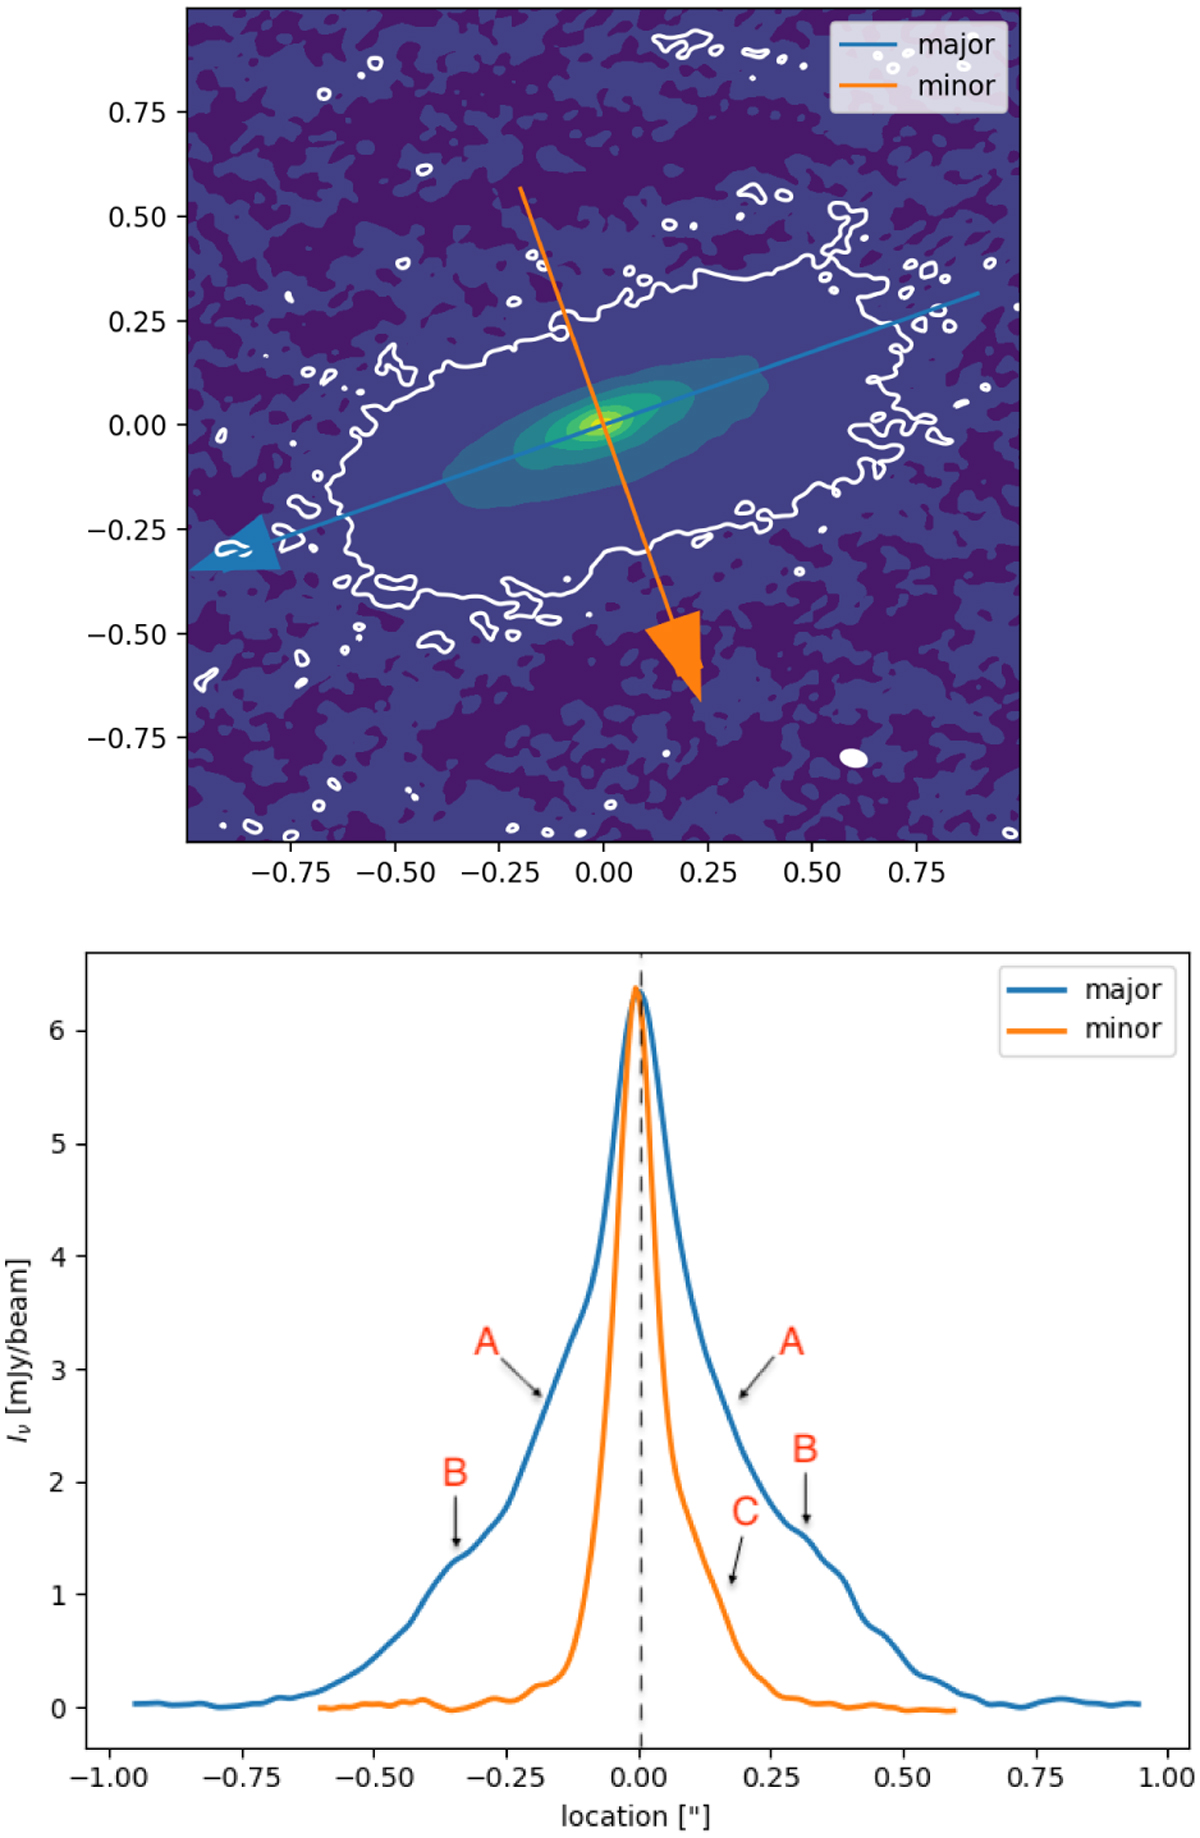
Radial intensity profiles on the dust continuum emission. Top: 1.3 mm continuum image. The major (blue) and minor (orange) axes are overlaid and show the direction of the cuts. The white contours show the 3σ level. The coordinates of the central position are RA=16h26m21.715s, Dec= –24°22’51″.709, which is the peak position derived from the 2D Gaussian fitting. Bottom: radial intensity profile cuts along the major and minor axes of the continuum disk. The black arrows point to the bumps labeled A and B for the major axis, and C for the minor axis. The dashed line shows the position of the continuum peak of the major axis derived from the 2D Gaussian fitting. The arrows in the top panel point to the positive part of the axis.
Current usage metrics show cumulative count of Article Views (full-text article views including HTML views, PDF and ePub downloads, according to the available data) and Abstracts Views on Vision4Press platform.
Data correspond to usage on the plateform after 2015. The current usage metrics is available 48-96 hours after online publication and is updated daily on week days.
Initial download of the metrics may take a while.