Open Access
Fig. D.3
Download original image
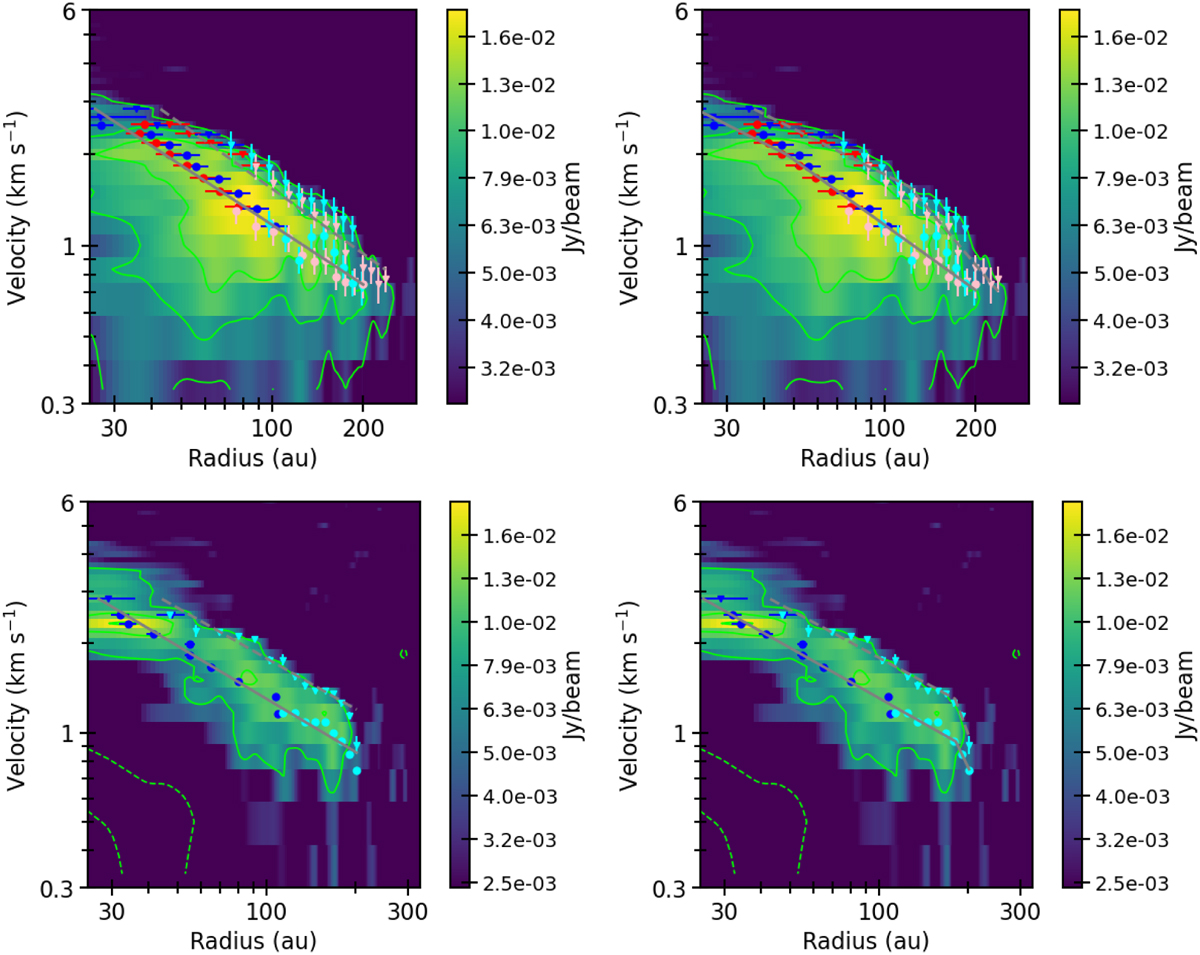
Position velocity diagrams of the SLAM fitting in logarithm scale. Top and bottom panels show the results for the C18O (2−1) and 13CO (2−1) emission, and the left and right panels those with single- and double-power law fitting, respectively. Symbols and colors are as shown in Fig. 7.
Current usage metrics show cumulative count of Article Views (full-text article views including HTML views, PDF and ePub downloads, according to the available data) and Abstracts Views on Vision4Press platform.
Data correspond to usage on the plateform after 2015. The current usage metrics is available 48-96 hours after online publication and is updated daily on week days.
Initial download of the metrics may take a while.