Fig. D.1
Download original image
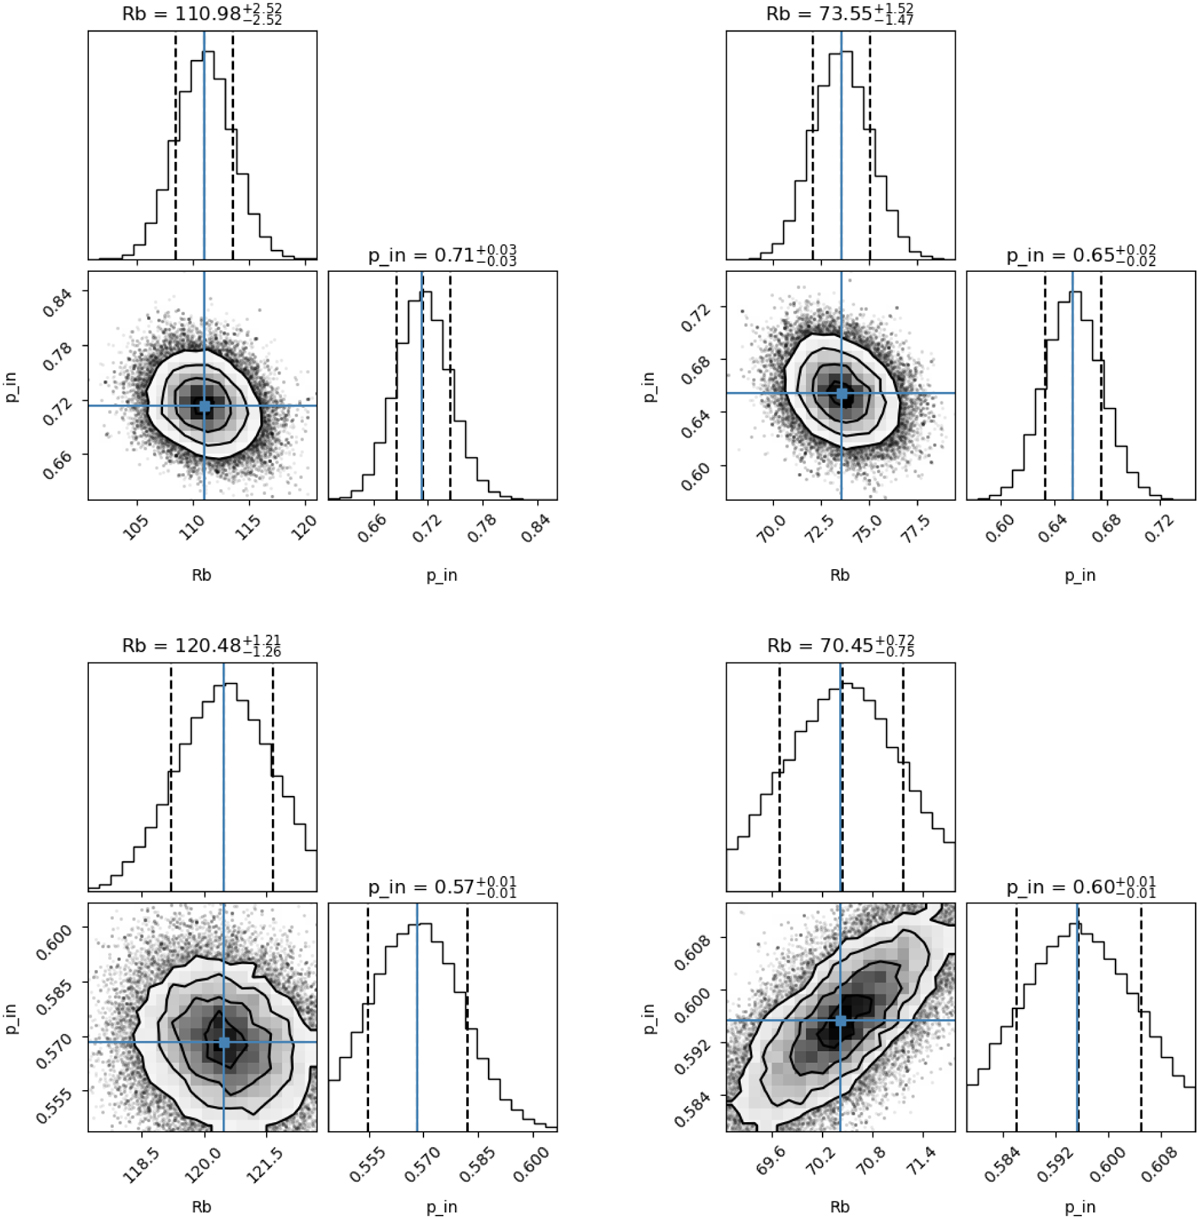
Corner plot of the SLAM fitting using single-power law fitting. Top and bottom panels show the results for the C18O (2−1) and 13CO (2−1) emission, and the left and right panels those with the edge and ridge methods, respectively. Dashed lines are the 16 and 84 percentiles. These plots shows that the prior ranges are wide enough to constrain the fitting parameters.
Current usage metrics show cumulative count of Article Views (full-text article views including HTML views, PDF and ePub downloads, according to the available data) and Abstracts Views on Vision4Press platform.
Data correspond to usage on the plateform after 2015. The current usage metrics is available 48-96 hours after online publication and is updated daily on week days.
Initial download of the metrics may take a while.