Fig. A.3
Download original image
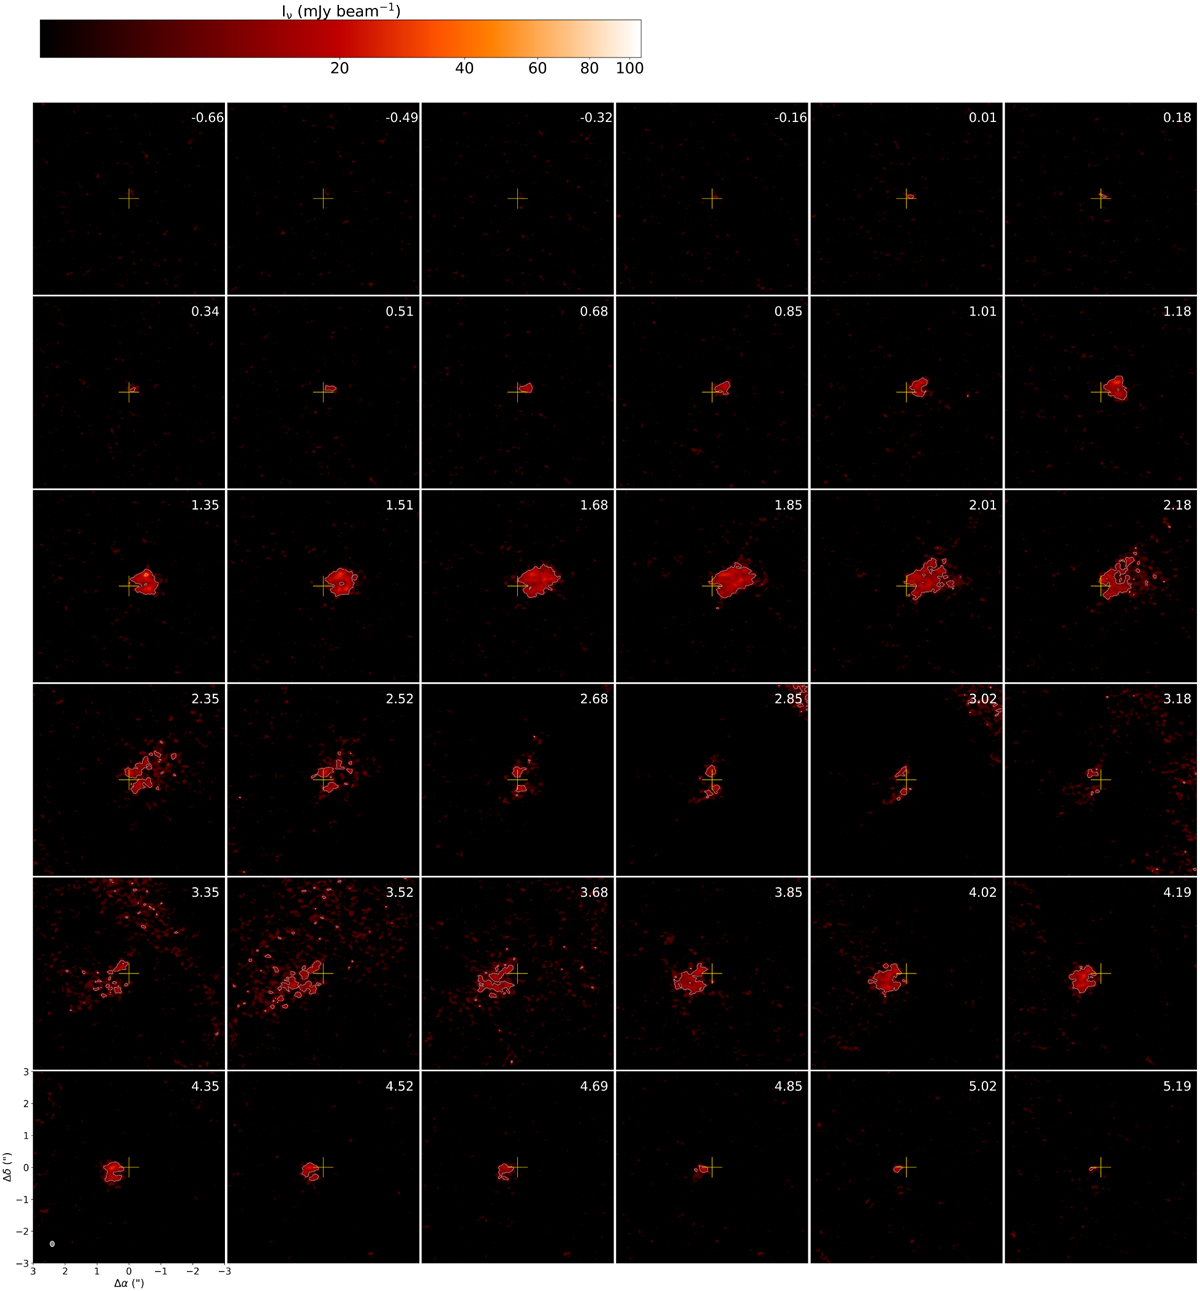
Channel maps of the C18O (2−1) emission in GSS30 IRS3. Emission is detected above 5σ from −0.66 km s−1 to 5.19 km s−1. The color scale is stretched using the inverse hyperbolic sine function. The lowest contour emission corresponds to 5σ (1σ corresponds to 1.83 mJy beam−1), with increments of 10σ. The field of view of the map is 6″ × 6″.
Current usage metrics show cumulative count of Article Views (full-text article views including HTML views, PDF and ePub downloads, according to the available data) and Abstracts Views on Vision4Press platform.
Data correspond to usage on the plateform after 2015. The current usage metrics is available 48-96 hours after online publication and is updated daily on week days.
Initial download of the metrics may take a while.